
It doesn’t matter which mining company report you look at, just about all of them list what their cash cost is to produce their main metal. Furthermore, the Silver Institute lists the primary silver miner’s cash cost per ounce from the Annual World Silver Survey on its website for all to see.
According to the Silver Institute:
Primary silver mine supply grew by 1 percent to account for 28 percent of global silver mine output. Mexico was the world’s largest silver producing country in 2012, followed by China, Peru, Australia and Russia. Primary silver mine cash costs rose to $8.88 an ounce, reflecting higher prices for labor, electricity, and maintenance charges.So, it seems as if the primary miners produced silver at $8.88 cash cost an ounce in 2012. This was up over 2011. Here are the cash cost figures for the past 3 years (World Silver Survey’s, Silver Institute & Kitco):
2010 = $5.47 (avg. spot price = $20.19)With low cash costs such as these, the silver miners should be raking in the dough and stating huge profits. However, a percentage of these primary silver miners are actually stating net income loses even at realized prices of $28-30 an ounce.
2011 = $8.11 (avg. spot price = $35.12
2012 = $8.88 (avg. spot price = $31.15)
When the World Silver Survey calculates the primary silver miner’s cash cost, they only use a sample portion. Let’s just say, this sample size is less than two-thirds of the silver produced from the primary miners. Even though the folks (GFMS, Reuters) who publish the World Silver Survey do a good job calculating the cash cost for the primary silver mining industry, we will find out how useless it can be in determining the profitability of a mining company.
Excellon Resources Very Low Cash Cost & Net Income Loss??
I selected Excellon Resources as they are a perfect example to show how a company can state a very low silver cash cost while reporting a net income loss. Now, I am not singling out Excellon or putting out negative information about the company, rather Excellon is actually a pretty good company that has the highest grade silver mine in Mexico.Let’s take a look at Excellon Resource’s Q1 2013 report on their cash cost:
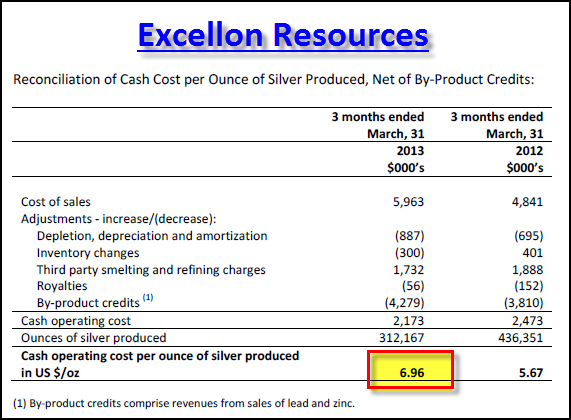
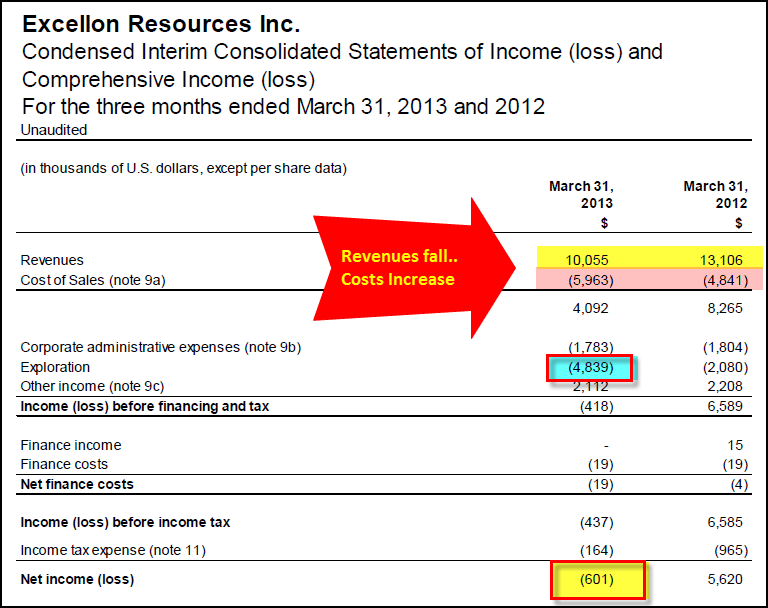
With this sort of low cash cost structure, Excellon should be making excellent profits. However, if we look at their Financial Statement for Q1 2013 we have the following:
CASH COST Change: $6.96 – $5.67 = +$1.29 ozSomething seems fishy. How could Excellon’s cash cost increase only $1.29, but their net income decline more than $6 million year over year?
First… we will notice, that revenues on the top of the table declined more than $3 million. That alone wipes off $3 million from their bottom line.
Second…. their Cost of Sales increased from $4.8 million to $5.9 million, year over year. So, that knocks off another $1+ million of net income.
Third… if we look at their exploration cost (in blue), we will see that it increased nearly $2.8 million compared to the same quarter last year. That erases at least another $2.5 million from their bottom line.
Without those three factors, Excellon would have shown a positive $6.5 million net income gain instead of a loss. As you can see, Excellon’s cash cost of $6.96 does not provide the investor a clue to the profitability of the company.
The Cash Cost Disclaimer
Anytime a company reports their cash cost in their financial reports they include the following explanation (I label it as a cash cost disclaimer) of their cash cost. This one is from Excellon’s Q1 2013 MD & A Report:Cash operating cost, net of by-product credits, is provided as additional information as is non-IFRS measure that does not have a standardized meaning. This measure should not be considered in isolation or as a substitute for measures of performance prepared in accordance with generally accepted accounting principles and is not necessarily indicative of operating expenses as determined under generally accepted accounting principles.IFRS stands for International Financial Reporting Standards and GAAP is the generally accepting accounting principles. Basically, cash costs are not indicative of operating expenses and are not in accordance with either the IFRS & GAAP.
What Caused Excellon to Lose Revenues & Profits?
So now that we know Cash Costs are bogus in determining the profitability of a company, let’s look at what happened to Excellon’s balance sheet.If you look at the table below there are TWO BIG Culprits that destroyed Excellon’s profitability compared to the same quarter a year ago.
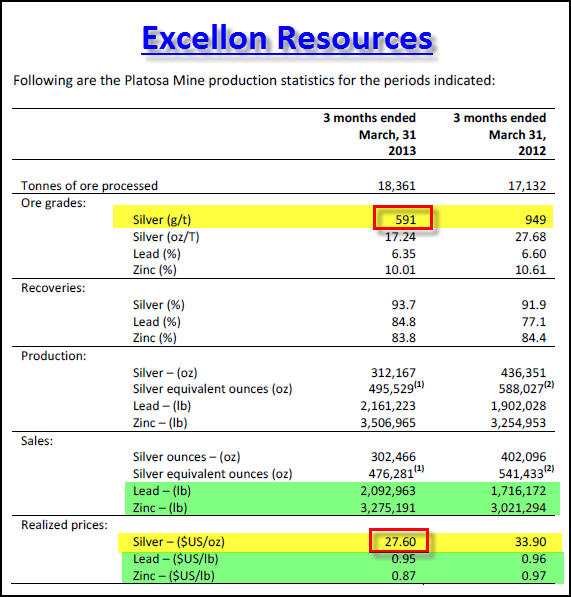
The next big hit came from their $6.30 decline in the price of silver they received shown at the bottom of the table. I highlighted the green areas to show the zinc and lead by-product data. We can see that zinc and lead were not part of the problem in profitability as the price of lead was the same while zinc fell half of what silver did.
Furthermore, both lead and zinc had higher production and sales. The practice of mining companies subtracting their by-product credits from their silver mining costs to show a LOW CASH COST obfuscates the TRUE BOTTOM LINE PICTURE.
What was Excellon’s Estimated Silver Break-Even Price
There are several ways to get to a pretty good estimated break-even price for a silver miner. You have to use either Net Income or Adjusted income and divide it by the Silver ounce sold during the quarter. Then you add or subtract that figure to their Realized Price that quarter.-$601,000 / 302,466 = -$1.99So, we can see that Excellon needed $29.59 an ounce silver to break even that quarter. This is a very simple and easy way to get an estimated break-even, however there are other more detailed methods which will be discussed in future posts.
$27.60 + $1.99 = $29.59 Net Income Break-Even
Total costs to mine silver are much higher than the industry is putting out in their financial statements. With the current low price of silver below $22, the majority of primary silver producers are losing a great deal of money. According to my calculations of my top 12 silver miners only ONE is making a little money.
Even though the mining stocks have declined substantially over the past few years, once the broader stock markets collapse, money will be forced to move into hold physical assets to protect their wealth. The mining stocks may turn out to be some of the best assets to own in the next several years.
http://srsroccoreport.com
2 則留言:
哈哈,睇來honson兄已完全對白銀紙價的大跌完全無感覺,恭喜你已踏上睇重量唔睇紙價的境界,飲杯!
Gordon 兄....
你又來玩我啦....飲杯
發佈留言