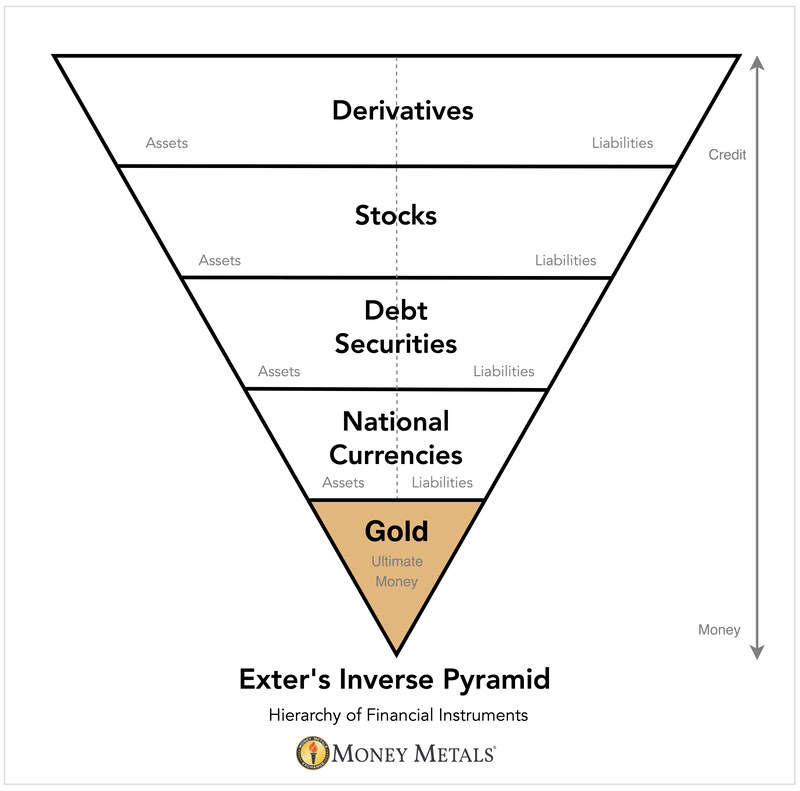
The People’s Bank of China (PBoC) continues to buy unprecedented amounts of gold as the global financial is deleveraging (i.e. investors exchange credit assets for gold).
In 2024, the Chinese central bank covertly bought 570 tonnes, encouraging gold’s ascent in global international reserves by 4%, the largest gain in four decades.
Gargantuan Gold Purchases by the Chinese Central Bank
This article is an analysis of formal and informal sources that indicate the PBoC is currently sitting on more than 5,000 tonnes of monetary gold located in Beijing – more than TWICE what has been publicly admitted.
Legacy media outlets routinely withhold crucial information from investors by principally reporting on official data on gold purchases by monetary authorities. In reality, the Chinese central bank is buying many multiples of what it’s officially disclosing, and investors should take note.
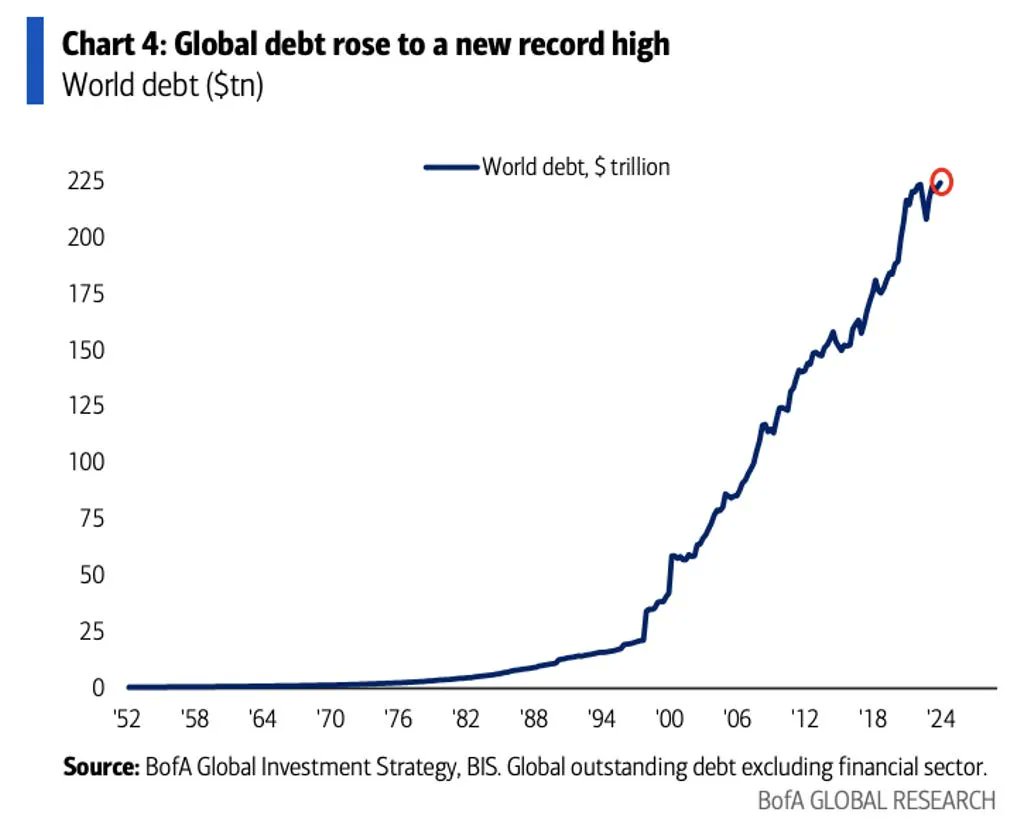
Combine large purchases by the PBoC and other regional central banks with initiatives in the East to settle trade through non-dollar ventures like mBridge and possibly gold stablecoins, and we should expect the international monetary system to continue shifting towards gold in the years ahead. Especially given today’s excessive debt levels, geopolitical tensions, and trade wars.
China Is Secretively Buying 5x More Gold Than Is Reported
Since the Ukraine war began, data show, China’s central bank has been buying roughly five times more gold than what it discloses to the International Monetary Fund (IMF).
But it’s more difficult to get an accurate estimate of how much it owned at the start of the war so we can determine how much it owns now, in total. More on that later.
Let us start off with data from the World Gold Council’s (WGC) quarterly Gold Demand Trendsreports on precious metal buying by central banks in aggregate. From the WGC:
Central bank demand is calculated using information from three different sources. Monthly International Financial Statistics produced by the IMF serve as an initial check for central bank transactions… A second vital source is confidential information regarding unrecorded sales and purchases. The final element in calculated net central bank purchases is analysis of trade flow data.
These confidential sources regarding unrecorded purchases and trade flow data are important themes in our present analysis, as there is no other way to ascertain what the PBoC does behind closed doors.
By comparing the WGC’s quarterly estimates with official data from the IMF, a glaring disparity is revealed since 2022 when the war in Ukraine broke out.
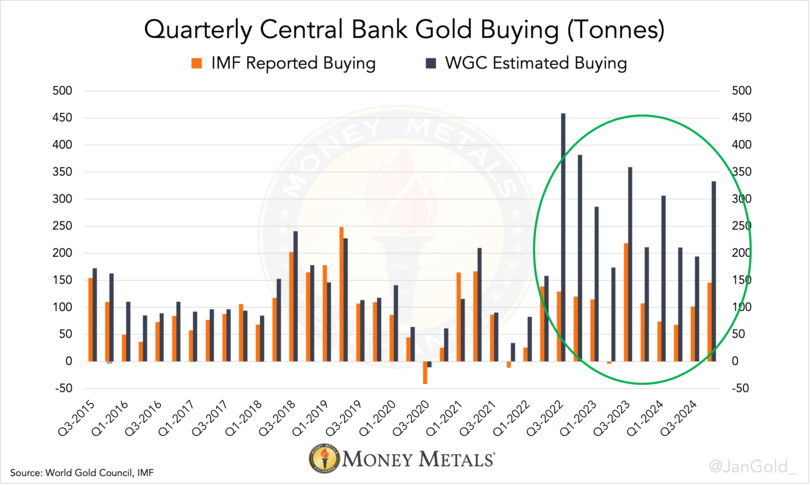
Chart 1. The difference between WGC and IMF data reflects unreported central bank gold buying.
According to two sources familiar with the matter, but who prefer to stay anonymous, the difference is mainly caused by “unreported purchases” by the Chinese central bank.
My approach has always been to take eighty percent of the difference between WGC and IMF figures and label that as secretive Chinese buying.
For instance, using this approach, I calculated that the People's Bank of China acquired 280 tonnes during the third quarter of 2022.
In December 2022, the Financial Times published a similar estimate that confirms the accuracy of my sources and methodology:
Mark Bristow, chief executive of Barrick Gold, the world’s second-largest gold miner, said China had bought tonnes of gold around the high-200s mark [in Q3 2022], based on his discussions with numerous sources.
Gold industry insiders—whether working at bullion banks, mining companies, refineries, consultancy firms, or secure logistics companies—sometimes exchange information. It’s through these interactions that estimates are conceived about the volume of secret gold buying by the Chinese central bank.
Thus, if one has access to one or multiple nodes in this network, it can piggybank on their intelligence. More on this below.
Other evidence of the PBoC’s covert gold acquisitions is the surplus in the Chinese gold market since 2022.
In the past three years, China’s import plus domestic mine supply exceeded withdrawals from the vaults of the Shanghai Gold Exchange (SGE). As the SGE is the center gold bourse in China—through laws and tax incentives most supply and demand flows through this exchange—an observed surplus must reflect acquisitions by the local monetary authority.
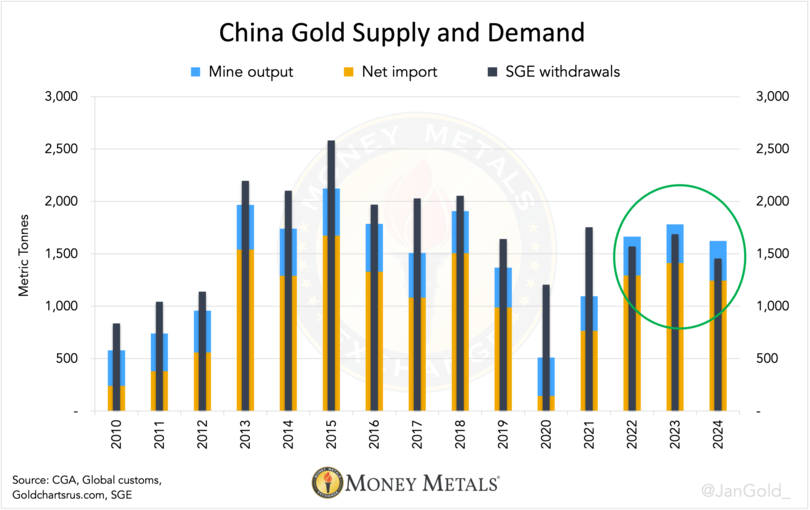
Chart 2. I’ve checked with sources close to the SGE that tell me the giant surplus is not being accumulated in SGE vaults, so it must end up in the PBoC’s vaults.
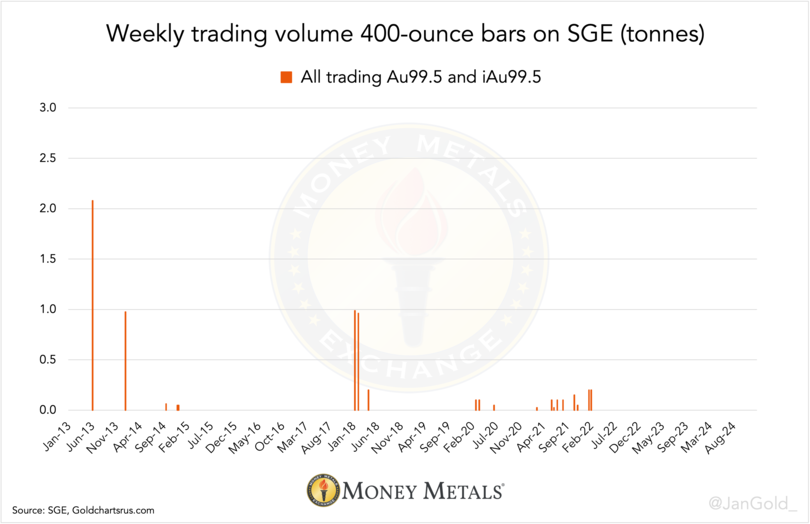
Another piece of evidence is the gold exported directly from the London Bullion Market to China. Because in London gold trade is conducted in large 400-ounce bars, but on the SGE, the private sector only trades in 1-kilogram bars, any gold moving directly from the U.K. to China is destined for the Chinese central bank.
The smoking gun as to Chinese government stockpiling is when we see a continuation of large exports from Britain to China whilst gold in Shanghai is trading at a discount versus London.
Obviously, no bullion bank would buy gold in London to sell at a loss in China. What actually happens is that the PBoC buys gold in London and lets bullion banks transport the metal to Beijing. In these circumstances, bullion banks (not the PBoC) must deal with customs departments and so the flow of gold is recorded.
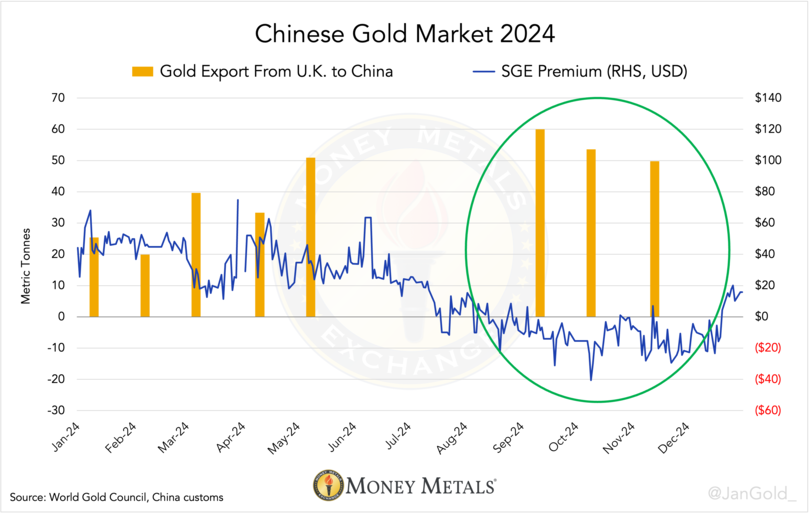
Chart 3. Gold exports of 400-ounce bars from the U.K. to China go straight to the PBoC. China’s central bank has surreptitiously bought 1,800 tonnes from Q3 2022 through the end of 2024, which is five times more than what’s officially reported.
The PBoC Secretly Holds 5,000+ Tonnes of Gold
For dessert, let’s estimate how much gold the Chinese central bank owns in total.
We know how much gold it bought every quarter going back to 2010 when the WGC’s Gold Demand Trends data began. To get a ballpark estimate of how much it owns now, all we need is an estimate of how much it owned at any point in time since 2010.
I have been fortunate that on two occasions well connected industry insiders shared with me how much they thought the Chinese central bank owns. On the first occasion, in late 2015, an insider told me that from within his network, he tallied 3,300 tonnes. The second source was more conservative and conveyed in June of 2024 his estimate was approximately 4,000 tonnes at that time.
When I reverse engineer the second estimate to 2015, then take the average of the two estimates, and calculate what has been added per quarter ever since, it produces an outcome of 5,065 tonnes for the end of 2024.
So, to the best of my knowledge, 5,065 tonnes is the weight of fine gold that the Chinese central bank currently stores in the capital Beijing.
China Lifts Gold in Global International Reserves
If we take into account the PBoC’s hidden gold reserves, as well as surreptitious additions by the Central Banks of Saudi Arabia and others, world official reserves reached an all-time high of 39,547 tonnes at the end of 2024.
As virtually all new monetary gold buyers are located in the East, non-Western gold holdings are rising rapidly and have reached 45% of world gold reserves. The following chart is a perfect visual representation of the shift in global power towards the East.
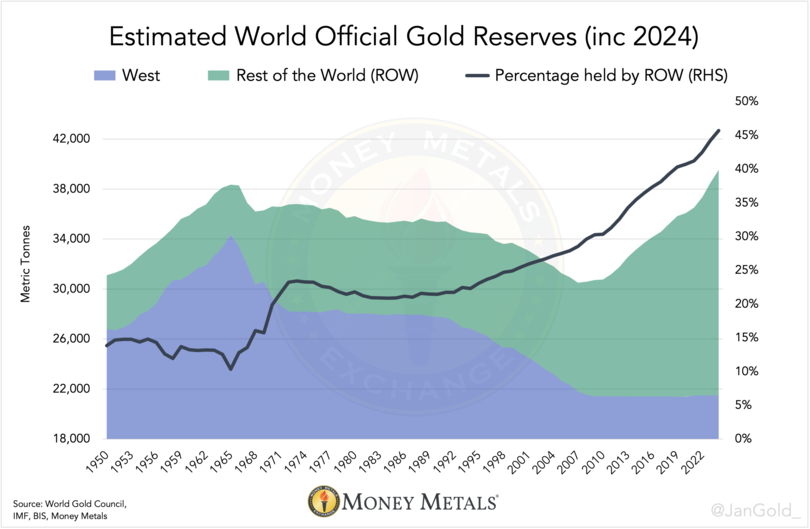
Chart 4. Non-Western central banks nearly hold as much gold as their Western counterparts.
My personal estimates of world official gold reserves, combined with Currency Composition of Official Foreign Exchange Reserves (COFER) data by the IMF, unveil gold’s percentage of global international reserves jumped up 4%, to 21%, in 2024. That’s the biggest surge in more than four decades.
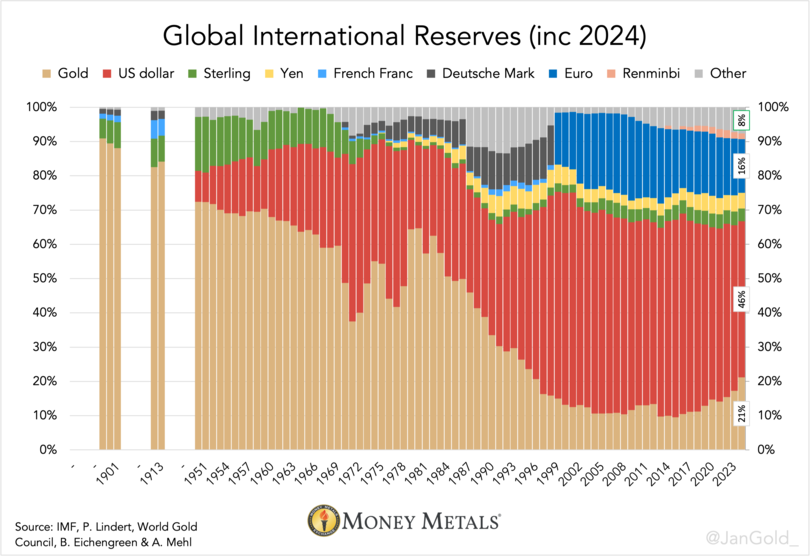
Chart 5. Next to gold, small currencies (“other”) are also on the rise in international reserves.
Next time you read claims that there is no de-dollarization actually occurring, please urge the naive writer to include gold in his statistics as to foreign reserves!
Notes
To properly understand why gold exports from the U.K. to China must be for the PBoC, please refer to my previous articles (here, here, and here) that take into account all the mechanics of the Chinese domestic gold market.


