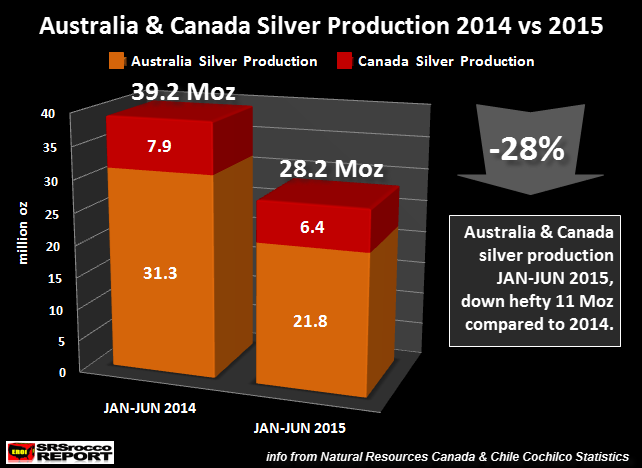
There is no other way to describe the radical change that has taken place in several areas of the silver supply market this year other than to say…. it’s quite shocking. While certain analysts stated that the silver supply would indeed fall this year, I don’t believe anyone could have envisioned the kind of declines displayed in the chart below.
When I first discussed this subject matter in an interview last month, I thought there might be a chance that this silver data was incorrect… a typo of some sort. However, the second quarter figures that were just released, do confirm just how dreadful silver supply has fallen from these two areas.
With the ongoing surge in physical silver investment demand and the rapidly falling Registered Silver Inventories at the COMEX, any decline in silver supply will only exacerbate the current tightness in the silver market.
Now, when we talk about “Declines”, the market normally states changes in the 2-5% range. This may not seem like a lot, but when we are discussing large figures, 2-5% can add up to a lot of silver. That being said, the figures shown in the graph below… ARE TOTALLY OFF THE CHARTS:
According to the data put out by official sources, Canada’s silver production (Jan-Jun) this year is down nearly 20% and Australia’s is down a stunning 30%. While it’s true that Canada isn’t a large silver producer, a 20% decline is still a big number in my book. The reason for the decline in Canadian silver production is due to several large base metal zinc mines shutting down operations last year.
As for why Australia’s silver production fell a whopping 30% decline (9.5 million oz) in the first half of the year, part of the reason may be due to a major drop in supply from the world’s largest silver mine… the Cannington Mine. Regardless, the combined silver supply from these two countries fell a stunning 11 million oz, 28% in just the first half of the year.
Even though silver production has declined from some of the other leading producers, it’s quite surprising to see the 4th ranked country in the world suffer a 30% reduction in supply in one year.
According to the data put out by several sources (Mexico INEGI, Peru Ministry of Energy & Mines, Australia Dept. of Energy & Resources and Chile’s Cochilco) here are the trends of the top five producers for half-year:
Top Five Silver Producers Change (Jan-Jun)
Mexico = -5%
Peru = +3.8%
China = EVEN
Australia = -30%
Chile = -6%
Unfortunately, falling world silver supply is taking place at the very same time as physical silver investment demand is skyrocketing. As I stated in several interviews, I believe the current draw-down of Registered Silver Inventories at the COMEX is mainly due to this huge increase investment demand as industrial silver demand is likely shrinking.
It will be interesting to see how events play out in the financial and broader stock markets over the next few months. If we do see major declines in these markets indices, this could cause even more investors to buy gold and silver.
If you think wait times of 2 months for certain silver investment products are long now… who knows how bad things could get in the future.


