曾經堅挺的白銀價格,猶如決了堤的洪水,一瀉千里無法回頭。以上海黃金交易所為例,在2012年9月13日創出7360元/千克的高位後,白銀T+D開始了下跌乃至暴跌之旅,以2013年6月26日最低價3666元/千克計算,白銀T+D區間價跌幅超過50%,遠超“套牢中國大媽”的黃金同期33%的跌幅。
銀價暴跌影響的不止資本市場的投資者,白銀冶煉生產企業更是深受其苦。國內白銀生產量最大的企業豫光金鉛,去年錄得首次虧損,銀價下跌成為最大推手。 《每日經濟新聞》記者調查發現,和外界通常的感受不同,身處白銀產業中游的首飾加工行業,以及下游的白銀終端銷售行業受到銀價下跌的影響極小。但其更安全的行業特性,吸引了大量資本湧入,白銀中下游面臨的主要難題不在於銀價,而在於慘烈的競爭。
上游
銀價暴跌重創冶煉企業兩龍頭業績一虧一降
銀價在2011年中達到高點,近兩年雖有反复,但基本趨勢是不斷走低。廣西南寧飛拓礦產有限責任公司的許經理向《每日經濟新聞》記者表示,銀價最高是在2008年,當時能賣到10元/克,如今只能賣到4.1元/克,接近4元/克的盈虧線。
綜合多位行業人士的分析,去年以來銀價下跌,主要是因為美國經濟好轉,美聯儲收緊寬鬆政策,美元走高,導致黃金和白銀的避險功能減弱,價格就一路下跌。
銀價下跌,首先受到衝擊的就是上游的銀礦開採企業。我國白銀的主產區包括江西、廣西、福建等省份。據《廣州日報》報導,我國一半的銀礦處於停產狀態。江西銀海礦業有限公司的李輝告訴記者,該公司開采的是混合礦,銀只是其中一部分。儘管開採白銀不划算,但還是會開採下去,但也只能勉強維持。
豫光金鉛套期保值謀扭虧/
地處河南的豫光金鉛,是國內白銀產量最大的企業。 2013年年報顯示,報告期公司生產白銀700.5噸,同比增長13.5%;實現銷售收入113億元,同比減少9.6%,淨利潤虧損-4.9億元。
對於巨額虧損,豫光金鉛解釋道,主要原因之一就是白銀價格的快速大幅下跌。
在豫光金鉛的主要產品中,電解鉛價格同比下跌7%,黃金價格下跌15%,白銀價格跌幅最甚,高達27%。白銀的毛利率為-2%,比上年下降8個百分點。
“目前銀價一直處於低迷狀態,沒有好轉,雖然公司今年一季度盈利了,但由於經濟持續低迷,第二季度和全年能不能扭虧比較難說。”豫光金鉛證券部人士6月4日對《每日經濟新聞》記者表示,“公司目前沒有採取停產減產的方式,但套期保值工作一直在做,希望減少損失,但想獲得較大利潤比較難。”
6月5日是豫光金鉛舉行的網上投資者接待日,豫光金鉛財務總監苗紅強當時表示,當前公司主要遇到包括金屬價格波動和匯率波動等困難,“因為公司是冶煉加工企業,對價格波動十分敏感”。
“不過,從第一季度看,比去年同期好,但是未來一個月白銀價格的不確定性,會使我們很難對上半年有準確的預期,感覺應該比去年要好一點。”苗紅強說。
為了應對銀價低迷的不利影響,苗紅強稱公司正積極採取措施提高今年業績,主要包括積極探討運用現貨、期貨、長單、定點銷售等各種營銷手段,爭取採購和銷售效益最大化。
金貴銀業增收不增利/
地處湖南郴州的金貴銀業,也是目前國內白銀年產量居前的企業。公司於今年1月剛剛上市,主要產品為白銀、電解鉛、黃金,主營業務為“從富含銀的鉛精礦及鉛冶煉廢渣廢液中綜合回收白銀及鉛、金等多種有色金屬”的清潔生產和銷售。
《每日經濟新聞》記者了解到,金貴銀業是白銀生產、出口的重要基地之一,其招股說明書介紹,公司擁有10萬噸鉛、200噸銀冶煉產能,在募投項目投產後,白銀產能將達到608噸。 2013年報顯示,白銀收入和利潤佔金貴營業收入和利潤的56%和68%。
近年來,白銀價格的大幅下跌,尤其是去年白銀價格大幅下跌,使得金貴銀業處於增收不增利的尷尬境地。
據統計,金貴銀業2011~2013年白銀銷售數量雖然不斷增加,但白銀銷售收入的增長卻並未同步跟上。資料顯示,金貴銀業2011~2013年白銀銷售數量分別為243噸、335噸和464噸,增長了90.9%;同期白銀收入分別為14.3億元、17.7億元和21.6億元,僅增長51% ;同期白銀業務的毛利率分別為19%、17%和17%,呈下降趨勢。
由於貴金屬價格的大幅下跌,金貴銀業上市後的一份年報就出現了業績下降。公司2013年淨利潤為1.6億元,同比下降6%,扣除非經常性損益之後淨利潤為1.2億元,同比下降14%。
“白銀價格一直比較低迷,對公司的影響大小可以參見財報,對於後期白銀價格判斷,需要董秘對外統一披露。”6月6日,金貴銀業證券部人士以董秘出差為由謝絕了採訪。
事實上,為應對銀價低迷給業績帶來的壓力,金貴銀業選擇“走量”加以應對。
4月28日,金貴銀業披露業績預告,預計今年上半年公司淨利潤6985萬元~8455萬元,淨利潤變動幅度為-5%~15%,公司解釋,業績變動主要是因為公司白銀產品在一季度銷量增長了40%,預計第二季度將會保持同樣增幅。
中游
賺加工費不賺價差白銀加工業少了風險丟了利潤
每經記者 楊長江 發自廣東海豐
27歲的龔偉達(化名)已是兩家銀飾加工廠的老闆,10餘名員工每年可以帶來上千萬的生意,但他到手的淨利潤卻只有幾十萬。 “我們不賺銀料的差價,只賺加工費,銀料可以客戶自己提供,也可以由加工廠向銀料商購買,但價格較為透明,一般不會賺取差價。”龔偉達說。
在廣東汕尾海豐縣的梅隴鎮,像龔偉達這樣的年輕老闆大有人在。汕尾市金銀珠寶首飾行業協會辦公室主任施華溢向記者介紹,粗略估計該鎮銀飾加工企業數量在1500家左右,各式珠寶加工企業數量超過2000家,全鎮約10萬人口中有3萬~4萬人從事該行業,其對當地GDP的貢獻率約為70%,是名副其實的支柱產業。
在坩堝爐、噴槍、焊槍、噴燈噴射的火焰的映襯下,砧台上鍛打著各色銀飾,聲音清脆而密集,混響在梅隴鎮的上空。人聲鼎沸、一片炙熱的背後,潛藏的卻是白銀加工行業,產業分散、作坊林立、企業盈利能力極弱、缺少品牌的冰冷現實。
儘管基本擺脫了銀價波動帶來的風險,但隨著人力成本的上升,梅隴鎮經營者們微利甚至是虧損局面愈發嚴重。
“老闆幫工人打工”/
入行7年的龔偉達儘管已經成長為老闆,但仍脫無法擺脫起早貪黑的勞碌。一大早開工到晚上22點後收工回家,他每天都要花費十幾個小時在工作上。
《每日經濟新聞》記者以銀飾零售商身份同龔偉達取得聯繫。在他其中一個工廠裡,記者看到,狹小的空間裡坐著七八個年輕的工人,他們正在細心地修飾著手中的銀料,按照客戶的要求,將其做成精美的手鐲、戒指、吊墜等銀飾產品。
在梅隴鎮首飾加工行業,“老闆幫工人打工”成了當地茶餘飯後的談資之一。記者的調查證實了這一玩笑話的真實性——小型加工廠老闆賺取的利潤低於員工薪資的現象普遍存在,在行情不好的情況下,虧損也要做。
即便如此,用工荒亦長期存在。記者在多家工廠門口看到,不少印有“長期招工”字樣的招聘海報已十分陳舊。
“人工成本很高了,最普通的工人月薪保底也是4000元,有點技術含量的老師傅就是1萬多。”龔偉達介紹說。
隨著沿海產業加速向內地轉移,此前很多外來務工人員都選擇了返鄉務工,而海豐作為經濟水平一般的縣級市,對內地勞務人員的吸引力正在下降。如此一來,企業招工不得不轉向周邊地區甚至是本地年輕人,這個群體對薪資待遇的要求比外來務工人員要高。
施華溢在接受記者採訪時多次強調,日益高企的人力成本和長期存在的用工荒矛盾是製約梅隴鎮首飾加工產業發展的主要瓶頸,從目前看來,這一難題基本無解。
廉價加工費/
梅隴鎮並不產銀,加工廠所需的銀料要么是客戶自己提供,要么是前者向當地銀料商購買。據介紹,梅隴鎮大概有10家銀料商,他們向銀礦拿貨,面向當地加工廠批發。
“我們從銀料商購買的白銀,價格比國際價格稍稍低一點,但是我們不賺取客戶的差價,都是以出貨當天的國際價格作為參考。”龔偉達透露,今年以來白銀價格下降對當地銀飾加工產業影響不大,原因在於加工廠利潤來源為加工費,而非銀料差價。
“要說影響,主要體現在價格波動較為劇烈的時候,客戶訂單可能會有所變化,比如在價格下降的時候,客戶出於觀望心態,下單會保守一些,但市場供需變化不大的情況下,影響還是有限的。”龔偉達介紹道。
龔偉達分析指出,當前銀價處在低點,這個時候進來相對保險,理由在於銀價不可能一直如此之低,待價格上漲,可賺取的利潤會更高。
至於具體的加工費,龔偉達舉例道,一個普通的銀手鐲,他收取的加工費在10元錢左右;一個30克的手鐲,若以每克4元錢的白銀價格計算,算上加工費,拿貨成本則為130元,這樣的產品在市場上大概可以賣到300元左右,有的甚至更高。以300元售價計算,梅隴鎮加工環節僅賺取了整個銀飾產業產值的1.3%。
《每日經濟新聞》記者還以客戶身份走訪了多家銀飾加工廠,模式基本與龔偉達一致,但由於不同產品的製作難度不同,以及廠家自我定位的差異,加工費有高有低。
“加工費看似很低,如果刨去所有成本,一個首飾只有幾毛錢的利潤,甚至更少,出貨量大的話,還是有利可圖的。”施華溢表示。
消費升級需求巨大/
通過大量走訪梅隴鎮的工廠、鋪面,《每日經濟新聞》記者發現,儘管規模各異、款式和價格有別,但各家銀飾工廠鮮有為客戶和市場發愁的。在該鎮的東怡首飾珠寶交易廣場,雖然烈日炎炎,但前來這裡“尋寶”的外地客商仍不少,甚至出現了多個外國人的身影。
“我們有一半的訂單來自歐美。”龔偉達說,只不過他不直接與海外市場對接,而是通過貿易商完成。他表示,外貿訂單的加工費要高於國內市場。
作為國內銀飾產品加工最大的集散地之一,梅隴鎮的銀飾加工產業規模近10年來發展速度驚人,這一方面得益於當地產業人士的傳幫帶,另一方面同日益增長的市場需求亦密不可分。
梅隴鎮首飾加工產業起源於1988年前後。香港金至尊珠寶創辦人,被稱為香港“一代金王”的林世榮就是梅隴鎮人,其在香港用380公斤黃金用以修廁所的事被梅隴人津津樂道。
“梅隴鎮首飾業的發展肯定受到他(林世榮)的影響,加上我們這裡距離深圳、香港比較近,有人出去做珠寶生意之後也帶出了很多人,這樣一來,回鄉創辦企業的也就漸漸多了起來,產業不斷成熟,大家看到能賺錢,於是越來越多的人開始做這個。”梅隴鎮副鎮長羅鴻雁表示。
據介紹,特別是在2000年之後,隨著國內經濟發展提速和人們生活水平的進步,首飾寶珠消費連年走高,有著天時地利人和的梅隴鎮,其首飾產業迅速壯大,加工廠也從彼時的100多家發展到現在的上千家,首飾加工產業一躍超過農業成為當地的第一大支柱產業。
下游
原料僅佔銀飾價格一成白銀終端“不患銀價患競爭”
每經實習記者 白亞靜 發自深圳
白銀價格大跌讓上游的生產商不堪其苦,中游加工環節則憑藉只收取加工費的模式得以“獨善其身”。對於白銀下游產業即終端而言,其所處環境比上游和中游都要好,一是銀飾品價格中銀原料的佔比較少,對銀價波動不敏感,不會出現上游廠商越產越虧的情況;二是直接面對消費者,利潤空間更大,而非加工環節只賺取附加值極低的加工費。
不過,由於白銀飾品終端受銀價波動極小,以及較高的利潤空間,大量資本蜂擁而至。激烈的競爭讓從業者步履維艱。
銀價波動對銀飾品影響小
中商情報網產業研究院奢侈品行業研究員林麗楠向《每日經濟新聞》記者介紹,“國際銀價下跌,對銀飾、銀製工藝品在零售環節的影響不大,價格依然堅挺。”
據記者走訪了解,銀價下跌所導致的行業萎靡並未波及零售端,或與兩方面因素有關,一方面銀料成本佔零售價格的比例低;二是消費者購買銀飾主要是作為消費品,而非投資品。
記者調查還發現,銀價下跌對於終端還有一定的促進作用。一位在深圳水貝首飾批發市場銀飾店工作了三四年的梁大姐說,“我店裡的貨不論925還是純銀,都是按克走件,每天隨國際銀價變動,然後再統一加手工費,很多來水貝批發的客人,如果進貨那天正好碰上銀價下跌,就會比平時多進一點。”在她看來,當銀價下跌時,客人們進貨就會豪爽很多,批發量會增加。
資料顯示,深圳水貝首飾批發市場聚集了2000餘家從事各類首飾禮品加工和銷售的企業及手工作坊,其首飾禮品的產能佔全國50%以上。
在水貝的一棟工業樓內,深圳市黃金珠寶文化研究會秘書長張祖輝告訴記者,零售端“黃金原料價格能佔黃金飾品、工藝品的八成,但銀製品的原料價佔不了這麼多,所以去年雖然金銀原料價都在降,但是大家多搶購黃金飾品,而少見搶購銀飾。”
另據記者在深圳花園城百貨的七度銀飾專櫃了解到,一款不到30克的990銀製手鐲標價近1000元。這意味著,零售的銀製產品將達30多元/克,而3.78元/克的銀料價在其中僅佔十分之一左右。
6月7日正值週末,該專櫃銷售郝小姐面帶喜色的說,“因為夏天比較熱,所以來買耳環、項鍊的年輕人越來越多。”
對此,林麗楠向記者解釋道,國內銀飾的消費者以35歲以下的時尚年輕人為主,比如大中專學生或者剛參加工作的愛美女性。在她看來,消費者將銀飾等作為時尚消費品,而非保值品,因此不會密切關注銀價。
銀價下跌難擋入行熱情
雖然水貝主打的是黃金珠寶,可在金碧輝煌的金店旁邊,白銀批發城、銀飾鋪、銀料加工廠的數量亦多的令人驚奇,往往三兩聚集,甚至門對門競爭。
“不論是批發還是零售,做的人越來越多,競爭太大了。”6月6日,在水貝市場的百分百銀飾銷售現場,其工作人員勞大姐無奈地說。
長期研究水貝市場的張祖輝也向記者介紹道,以前街面只有幾家銀飾批髮店,但現在非常多。據他了解,新增投資中,不光有業內資金,也有業外資金,其中業外的投資者一般將資金投進後便由業內人士操盤,而這些業外資金中有相當一部分來源於服裝、餐飲行業。
但是,銀價在下跌,為什麼入行者不減反增呢?據張祖輝向記者解釋,這主要是由三方面因素造成的,一是當下其他行業的生意都不好做;二是白銀的前期投入相對少,約一兩千萬就可以做得很大;三是白銀畢竟屬於貴金屬,相較其他行業,這個行業還是相對穩定的。
趨勢
白銀價格走勢分歧大
每經記者 胡飛軍
與黃金類似,白銀可以作為保值和流通工具,具有投資屬性。與此同時,白銀又有很強的工業屬性,50%的白銀需求來源於工業用途,遠高於黃金的11%。經濟發展和投資需求都可能支持銀價上漲。
對於銀價長期低迷,卓創資訊貴金屬分析師週姣告訴《每日經濟新聞》記者,近年來全球經濟處於築底企穩的階段,工業發展增速明顯放緩,使得白銀用量難有增加,缺乏需求支撐,銀價上漲乏力。
“實際上,全球僅有約17%的白銀用於投資及套期保值”,週姣認為,目前消費者的投資熱情偏弱,這對銀價來說也是利空。
週姣分析道,未來銀價或先抑後揚。 “一組數據或能很好地支撐這一判斷,金銀地殼含量1:17,但目前世界儲量金銀比是5:1,這說明白銀更為稀缺,加之白銀是工業的必需品,後期增值空間巨大。”
中投顧問高級顧問劉建修也表示,“2014年工業領域白銀需求將增加,主要需求來自於電子行業。”
據巴克萊數據統計,2013年全球白銀製造業總需求達到27182噸,同比增長3.2%,扭轉2012年下滑的趨勢。受全球經濟進一步回暖刺激,工業用銀需求恢復至14708噸,同比增長1.5%。
商務部對外貿易司的報告則持不同意見:在美國QE縮減購債、全球經濟復甦進一步企穩的大環境下,整個大宗商品市場的不景氣,加之美元和美債收益率逐步走強,避險資產將繼續失寵於投資資金。儘管工業需求穩定,但因缺乏投資需求支撐,2014年銀價將跟隨金價向下找底,預計2014年國內銀價平均在4450元/克,並在3560~6000元/千克區間震盪。
豫光金鉛財務總監苗紅強認為,有色金屬在去年經過大幅度下跌後,目前進入盤整期,技術面看下跌的幅度有限。冶煉廠目前大都在虧損,從供需層面看不會像去年那樣大幅度下跌,後續看漲的概率大一些。
“影響有色金屬價格的因素很多,現在要去判斷未來幾個月有色金屬的價格確實很難。個人的看法還是盤整向上。”苗紅強認為

2014年6月20日星期五

2014年5月27日星期二
成本5元現價4.1元 半數銀礦減產自救

 |
| 今年下半年銀價仍可能低位窄幅盤整 |
“我們挖礦的成本就超過5元/克,可現在國際現有銀價在5元以下運行已經有1年了,越挖越虧,不如不挖了。”廣西一家中型銀礦的股東羅先生如是對本報記者抱怨。
2014年4~5月,白銀產銷全行業瀰漫著濃重的不景氣陰霾:禮品市場不景氣,導致白銀工藝品、銀首飾滯銷;白銀價格全面跌破25美元/盎司(5元/克)成本線的時間剛好是一年,企業虧損嚴重,不得不減產停產謀求自救。經營之慘烈,較金礦企業有過之而無不及。
今年下半年金價維持熊市是大概率事件,業內人士普遍看空未來半年的白銀市場,銀價波動頻率與投資獲利空間有可能繼續變小。因此,建議市民持有謹慎觀望的態度,長線的家庭投資者可以逢低買銀條、銀幣。
調查:
銀礦坑道越挖越深
成本翻了一倍多
中國挖銀礦的成本超過了現時銀價,並非個別現象。記者遍訪廣西、廣東、福建三地的貴金屬礦藏了解到,與金礦停產不同,銀礦停產,在2014年二季度後的國內貴金屬行業,屬於一個非常常見的現象。
“可以這麼說,超過50%的內地銀礦(白銀採掘為主的礦藏),目前都存在減產或停產現象,而在金礦,這個數字不超過20%。”廣東省黃金協會的兩家會員企業非常肯定地告訴記者。
銀礦的採掘成本到底有多少?深圳眾恒隆實業有限公司的甘武深總經理告訴記者,銀礦採掘的成本主要分為技術挖掘成本與人工成本兩個項目,分別佔據70%與20%的比例,其他成本則佔10%。一方面,由於連年開採,中國部分銀礦(尤其是北方礦場)的品級下降,坑道越挖越深,單位技術挖掘成本直接上升,由2010年之前的每克1.5元/克,上漲到了而今的3~3.5元/克,翻了一倍有多。
另外一個方面,自2009年至今,大多數的貴金屬礦藏中,人工成本一直在上漲,金屬礦藏的工人基本年薪由之前2萬~3萬元,走高到了目前的4萬~6萬元。在此情況下,2012年中開始,國內銀礦的採掘成本已經普遍衝破4.5元/克的大關。
而金礦與之相比,情況要好很多。雖然都是從2012年開始暴跌的,但國際金價至今距離最高點的暴跌幅度也不過只有32%,銀價則暴跌了60%。再者,由於富礦開采的比例較大,中國內地的金礦採掘成本普遍在1000美元/盎司大關附近位置,仍比目前1300美元左右的國際金價低出了約25%的幅度。
企業:
減產20%~70%
交易所套期保值
記者從廣東省黃金協會、廣東貴金屬交易中心等地了解到,面對連月虧損,絕大多數銀礦企業都採取了自救措施。一方面,與銅採掘企業類同,數量眾多的企業都在採取減產自救的措施。
曾先生是粵西一家大型白銀採掘加工企業的老闆,他告訴記者,自己旗下的十幾家採掘場,目前有兩家正在停業“整頓”,目的就是減產自救,其餘還有7家礦場也都在減產,減產幅度在20%~70%不等。
“目前挖礦一定是虧錢的,但我們之所以還在運營,主要是因為還有製造業,需要加工銀首飾、銀錠、工藝銀條,變變花樣爭取些利潤,彌補挖礦的損失。 ”曾先生說。但禮品市場持續不景氣,記者從深圳水貝珠寶市場了解到,2014年白銀工藝品的交易量較2012年的下跌幅度也超過了20%,遠遠趕不上黃金首飾的交易。
另外一個方面,很多企業加入了“套期保值”的行列,從期貨交易中尋求風險規避。廣東省貴金屬交易中心2014年春節以來,會員企業大增30%,其中有相當一部分就是白銀現貨經營背景的企業。
後市預期:
明年或先於黃金回暖
雖然中國企業採取了種種自救措施,但國際銀價並不是只以中國內部的供需關係來決定其走勢。由於是貴金屬的一個品種,國際白銀價格依然以黃金價格“馬首是瞻”,在此之外,全球白銀的整體供需關係也是決定銀價走勢的關鍵因素。
美聯儲“削債”政策決定黃金價格延續“熊市”,間接打壓銀價維持低位;但銀價對比黃金的有利條件在於:美國經濟正在回暖,白銀的工業需求正在增長中,促進銀價盡快回暖。
後市銀價決定於以上兩個因素的“博弈”。 2014年,國際銀價維持低位盤整的可能性比較大,波動幅度或有限;但2015年,銀價或先於金價出現明顯的回暖。
對投資市場的影響
T+D類產品波動頻率減小獲利空間減少
銀價長期位於採掘成本價下方運行,對於居民投資會產生什麼影響呢?
記者採訪了香港金銀貿易場的幾家會員企業,普遍認為,對於T+D類產品的作用力比較消極,這是因為:亞洲投資者普遍持有買漲不買跌的觀念。行業持續不景氣、價格持續低迷,會影響機構參與投資的熱情,容易在T+D市場形成多空對峙的觀望氛圍。
而事實上,4月底以來,國內白銀市場交易不斷縮水;以上海黃金交易所白銀T+D產品為例,3~4月,白銀T+D日交易量多有100萬手以上,但近1個月裡,這個數字卻基本沒有出現過,日交易量基本在30萬~80萬手之間徘徊。其他交易所的情況與之類似。
廣州資深投資者劉先生對記者表示:“行業不景氣,不僅是銀礦如此,也會波及白銀的加工、投資領域。我以往三年熱衷做空白銀,但如果市場沒有其他人做多,銀價就不可能出現大的波動,獲利空間也隨之縮小。”
廣州京鑫的朱志剛認為:“國際機構對於貴金屬市場的重視度減低,短線銀價缺乏寬幅振蕩的基礎,窄幅波動局面可能延續至6月底,在此期間,普通投資者應多觀望、少操作。而在8月之後,隨著需求旺季到來,銀價波幅或加大,建議高拋低吸、區間投資獲利,不建議一味做多或一味做空。”
對於銀價形成支撐銀條長線投資機會出現
但是,對於銀條、銀幣等傳統、保守投資品種來說,銀價長期跌破白銀成本價,卻容易產生積極的意義。
白銀主要是商品,而任何商品的價格都不可能低於成本價運行太久,白銀而今的走勢已屬反常。白銀的成本價將對銀價構成持續而強力的支撐,銀價在目前價位上大幅下跌、超過15%的可能性較小。
為此,對於家庭投資者來說,如果想買銀條,而今時間段正是長線建倉的機會,可以逢低買入,也可逐步買入;銀幣市場整體低位波動,且回暖氣息濃厚,也值得關注。
不過,白銀並非家庭投資不可或缺的組成部分,富裕型投資者或者金條購買足量的投資者可以考慮購買銀幣銀條,其餘投資者仍應優先買金。
http://finance.ifeng.com/
2013年11月27日星期三
什麼時候白銀礦業公司才能停止虧損
據外媒報導,一直下跌的銀價給白銀公司帶來了不少的壓力,這對於那些已經不能在低價獲利的白銀礦業公司來說尤其是這樣。這些就包括Coeur d'Alene Mines這樣的大公司。該公司第三季度的虧損達到2340萬美元。白銀的平均價格在21.06美金每盎司。由於白銀的價格朝著20美金每盎司的關口異動,所以對於該公司來說事情並不好。
和今年第二季度相比來自銀礦操作活動的現金流下降了57個百分點。儘管處於如此危險的情況下,白銀礦業公司還是表示在如此的市場環境下還是可以找到新的發展機會的。 Coeur d'Alene公司宣布了形成一個新的全資子公司-Coeur Capital將會持有該公司目前的未來版稅和流媒體利益。該公司同時宣布將會收購Global Royalty。
另外一家白銀礦業公司Hecla Mining已經使用了低迷資產價格來使得黃金產量多樣化。該公司通過提供500m美金即6.875%直至2021年的優先票據來對Aurizon Mines收購進行財政支持。
和今年第二季度相比來自銀礦操作活動的現金流下降了57個百分點。儘管處於如此危險的情況下,白銀礦業公司還是表示在如此的市場環境下還是可以找到新的發展機會的。 Coeur d'Alene公司宣布了形成一個新的全資子公司-Coeur Capital將會持有該公司目前的未來版稅和流媒體利益。該公司同時宣布將會收購Global Royalty。
另外一家白銀礦業公司Hecla Mining已經使用了低迷資產價格來使得黃金產量多樣化。該公司通過提供500m美金即6.875%直至2021年的優先票據來對Aurizon Mines收購進行財政支持。
2013年9月5日星期四
BREAKING: Silver Miners Lose Half A Billion Dollars
銀價下跌,礦商已出現嚴重虧損
In an amazing change of events, the top primary silver miners went from making money in the first quarter of 2013, to losing over half a billion dollars in second quarter. The majority of losses came from huge impairment charges due to much lower silver spot prices during the period.
If we look at the chart below we can see how three months and substantially lower silver prices can impact the bottom line in the top 12 primary silver miners:
From the SRSRocco Report:

Starting at the top of the table, total Revenues from group declined from $804.9 million in Q1 down to $739.9 million in Q2 2013. This was only a $65 million decline or 8% less than the previous quarter, but the group sold a great deal more silver and still suffered a large loss.
You will notice that in Q1, there were 20.3 million oz in silver sales, however in the second quarter the top 12 miners sold nearly 4 million more ounces or a total of 24.1 million oz. Furthermore, the by-product credits increased from $254.8 million in Q1 to $272.8 million during Q2 2013.
Not only did the top 12 primary miners sell nearly 20% more silver and $18 million more in by-product metal revenue compared to the previous quarter, they recorded a $544.6 million net income loss instead of a $90.7 net income gain during Q1 2013.
Again, the majority of the half a billion dollar loss was due to impairment write-offs by the companies from much lower average silver prices reflected during the second quarter – Silver Standard took a $202 million impairment charge and Pan American wrote off $185 million.
This turns out to be an amazing $183 million dollar net change from quarter to quarter ($94.4 + $88.3 = $182.7 million).
As a refresher, many companies provide adjusted income by taking out impairment charges, acquisitions/sales of properties, losses due to derivatives and etc. If a company does not provide an adjusted income, I manually calculate it myself. This adjusted income figure does not meet exact accounting standards… but it comes pretty close.
The reason why we have to go by adjusted income is due to the fact that net income becomes totally useless in obtaining a break-even cost analysis if it contains a great deal of gains or losses not attributed to the day-to-day operation of mining silver.
For example, if you look at the bottom of the chart, you will see that the miners as a group stated a net income loss of $22.51 per ounce of silver. Which means they would need $45.14 an ounce to break-even… according to the net income approach. Those huge impairment write-offs have significantly skewed the ability to find a more common sense break-even.
Before we get to the next chart, take a look at the yellow highlighted area. This is the mine operating earnings which account for production costs, royalties and depreciation, depletion & amortization… and that’s it. It does not include general & administrative, exploration, foreign exchange losses and etc.
In just one-quarter, the mine operating earnings of the group fell from 29.9% of total revenue down to 5.1%. That means the remaining 5.1% of the income had to pay the rest of the bills including taxes.

According to my calculations of the top 12 primary silver miners in my group, the average realized price received during Q2 2013 was $22.63. The white dotted line shows where this $22.63 level falls. As you can see, it runs below nine of the silver companies. Thus, nine of the silver miners had adjusted losses for the period.
The BLUE BARS represent the “Adjusted Break-Even” for each of the twelve silver miners. The large RED BAR shows the average adjusted break-even for the group. In order for the top 12 primary silver miners to break-even as a group, they had to receive $25.26 an ounce during the second quarter.
Because the average realized price of silver was only $22.63, the group lost $2.63 of silver income for every ounce of silver they sold in Q2 2013. Before we go any further, let me explain my method.
The adjusted income loss was $88.3 million. So, if we were to divide that figure by 24.1 million oz of silver sales, it would show a $3.66 loss per ounce and not the $2.63 that I calculated. The reason for the difference is that I believe part of the gain or loss of adjusted income is attributed to the by-product metal revenue.
If a mining company receives 60% of its revenue from silver and 40% from its by-product credits (revenue), then part of the adjusted gain or loss comes from either that copper, lead, zinc or gold that was sold. Again, my method is to find a more “Pure Silver Income.”
Heading back up to the table at the top of the article, you can see that the Estimated Break Even (pure silver) in Q1 2013 was $26.45 and in Q2 it had fallen to $25.26. Part of the reason why I believe this figure declined was due to cutting of costs as well as more revenue received from by-product metals.
Yes, I realize that the production costs increased substantially from $416 million Q1 to $512 million in Q2, but that was mainly due to Coeur & Hecla ramping up production compared to the previous quarter.
There is so much more to explain and discuss on these matters, but that will be available in the “Silver Miners Paid Report” that will be coming out soon.
A mining company can not survive by breaking even for an extended period. It needs profits to sustain its business model of replacing reserves as well as dealing with rising costs in the future. I have read where individuals believe the mining companies can produce silver at much lower prices while hiding profits through supposed tax write-offs such as depletion, depreciation and amortization (D,D & A).
I am not going to get into details on D, D & A, but I will make a brief point by using Pan American Silver as an example:

The yellow highlighted area shows the depreciation & amortization (D & A). If we just look at Q2 2013, you will see that Pan American recorded a $32.2 million for D & A. That $32.2 million figure was not an actual cash expense but an estimated operational expense that denotes the decline in value of the mine, plant & equipment.
If you go down to the red highlighted area, you will see that they made payments of $44.3 million for mineral property, plant and equipment. According to their segmented information on capital expenditures for Q2 2013, Pan American actually spent $46.8 million on their seven mines during the second quarter.
While that $32.2 million in depreciation & amortization is not an actual operational expense for the quarter, that $46.8 million in CAPEX sure is. Basically, Pan American spent more on CAPEX in Q2 than it recorded for its D & A. Here we can see that maintaining mines, plant and equipment is an expensive affair for the mining industry.
Even though my estimated break-even for the top 12 primary silver miners was an average of $25.26 an ounce, at least five in the group would lose money at that price. Moreover, these miners need to make profits to sustain their business in the future. I would imagine a price of at least $30 an ounce would be needed by the group and even higher for the marginal producers if they want to stay in business for the longer haul.
Lastly, as the primary silver miners are presently struggling with manipulated low prices, I believe market conditions will turn around, making this industry one of the most successful investments in the future.
More on that in upcoming articles.
In an amazing change of events, the top primary silver miners went from making money in the first quarter of 2013, to losing over half a billion dollars in second quarter. The majority of losses came from huge impairment charges due to much lower silver spot prices during the period.
If we look at the chart below we can see how three months and substantially lower silver prices can impact the bottom line in the top 12 primary silver miners:
From the SRSRocco Report:
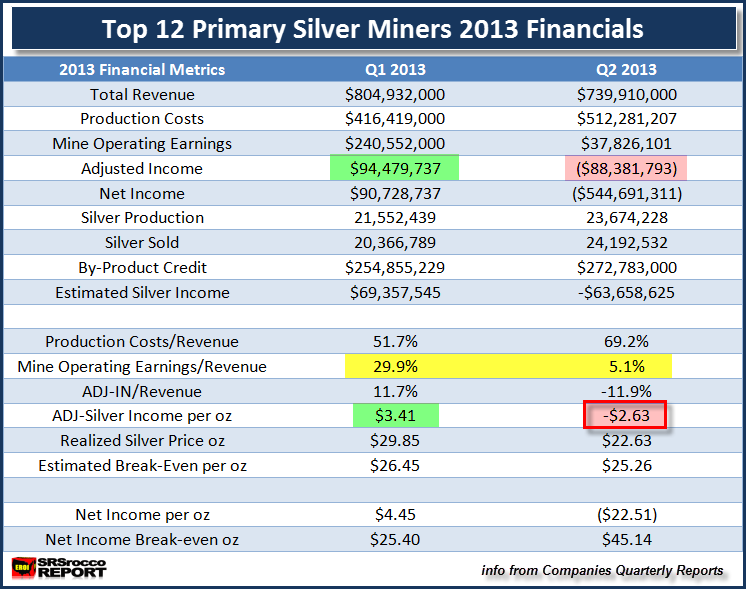
Starting at the top of the table, total Revenues from group declined from $804.9 million in Q1 down to $739.9 million in Q2 2013. This was only a $65 million decline or 8% less than the previous quarter, but the group sold a great deal more silver and still suffered a large loss.
You will notice that in Q1, there were 20.3 million oz in silver sales, however in the second quarter the top 12 miners sold nearly 4 million more ounces or a total of 24.1 million oz. Furthermore, the by-product credits increased from $254.8 million in Q1 to $272.8 million during Q2 2013.
Not only did the top 12 primary miners sell nearly 20% more silver and $18 million more in by-product metal revenue compared to the previous quarter, they recorded a $544.6 million net income loss instead of a $90.7 net income gain during Q1 2013.
Again, the majority of the half a billion dollar loss was due to impairment write-offs by the companies from much lower average silver prices reflected during the second quarter – Silver Standard took a $202 million impairment charge and Pan American wrote off $185 million.
NOTE: My top 12 primary silver miners do not include Fresnillo or Hochshild. While both of these companies are primary silver miners, they only state their financials every 6 months. It is true that Fresnillo recording profits for the year, however Hochschild reported a loss. Also, Fresnillo now receives more revenue from gold than silver.
ADJUSTED INCOME: The Tell-Tale Sign of Profitability
Regardless, the real tell-tale sign of the quarter to quarter profitability of a mining company is shown by its “Adjusted Income.” Highlighted in green, the primary silver miners as a group recorded $94.4 million in adjusted income during the first quarter of 2013. However, just three months later they stated an adjusted income loss of $88.3 million.This turns out to be an amazing $183 million dollar net change from quarter to quarter ($94.4 + $88.3 = $182.7 million).
As a refresher, many companies provide adjusted income by taking out impairment charges, acquisitions/sales of properties, losses due to derivatives and etc. If a company does not provide an adjusted income, I manually calculate it myself. This adjusted income figure does not meet exact accounting standards… but it comes pretty close.
The reason why we have to go by adjusted income is due to the fact that net income becomes totally useless in obtaining a break-even cost analysis if it contains a great deal of gains or losses not attributed to the day-to-day operation of mining silver.
For example, if you look at the bottom of the chart, you will see that the miners as a group stated a net income loss of $22.51 per ounce of silver. Which means they would need $45.14 an ounce to break-even… according to the net income approach. Those huge impairment write-offs have significantly skewed the ability to find a more common sense break-even.
Before we get to the next chart, take a look at the yellow highlighted area. This is the mine operating earnings which account for production costs, royalties and depreciation, depletion & amortization… and that’s it. It does not include general & administrative, exploration, foreign exchange losses and etc.
In just one-quarter, the mine operating earnings of the group fell from 29.9% of total revenue down to 5.1%. That means the remaining 5.1% of the income had to pay the rest of the bills including taxes.
The Top 12 Primary Miners Q2 2013 Estimated Break Even
This next chart shows what happens to the primary mining industry when the price of silver is taken down by the Fed and Central Banks.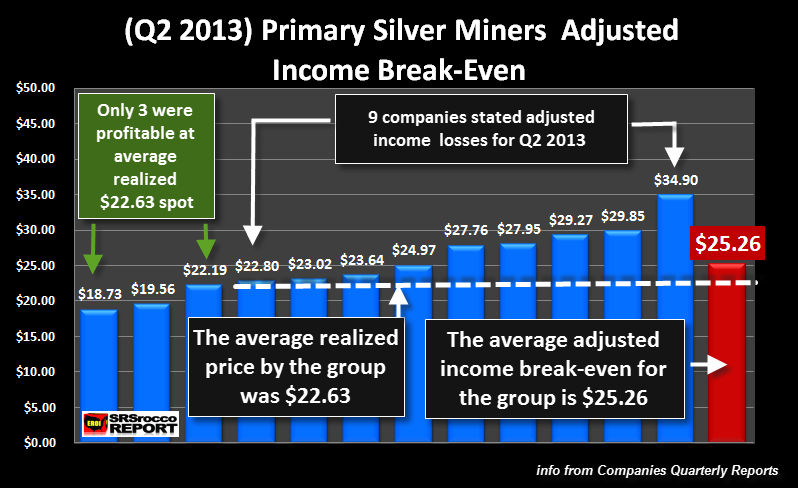
According to my calculations of the top 12 primary silver miners in my group, the average realized price received during Q2 2013 was $22.63. The white dotted line shows where this $22.63 level falls. As you can see, it runs below nine of the silver companies. Thus, nine of the silver miners had adjusted losses for the period.
The BLUE BARS represent the “Adjusted Break-Even” for each of the twelve silver miners. The large RED BAR shows the average adjusted break-even for the group. In order for the top 12 primary silver miners to break-even as a group, they had to receive $25.26 an ounce during the second quarter.
Because the average realized price of silver was only $22.63, the group lost $2.63 of silver income for every ounce of silver they sold in Q2 2013. Before we go any further, let me explain my method.
The adjusted income loss was $88.3 million. So, if we were to divide that figure by 24.1 million oz of silver sales, it would show a $3.66 loss per ounce and not the $2.63 that I calculated. The reason for the difference is that I believe part of the gain or loss of adjusted income is attributed to the by-product metal revenue.
If a mining company receives 60% of its revenue from silver and 40% from its by-product credits (revenue), then part of the adjusted gain or loss comes from either that copper, lead, zinc or gold that was sold. Again, my method is to find a more “Pure Silver Income.”
Heading back up to the table at the top of the article, you can see that the Estimated Break Even (pure silver) in Q1 2013 was $26.45 and in Q2 it had fallen to $25.26. Part of the reason why I believe this figure declined was due to cutting of costs as well as more revenue received from by-product metals.
Yes, I realize that the production costs increased substantially from $416 million Q1 to $512 million in Q2, but that was mainly due to Coeur & Hecla ramping up production compared to the previous quarter.
There is so much more to explain and discuss on these matters, but that will be available in the “Silver Miners Paid Report” that will be coming out soon.
Estimated Break-Even is Not a Sustainable Figure
I want to make sure that the reader-investor realizes that a break-even figure is not something a mining company shoots for. They are in the business to make profits. From those profits the company can acquire more properties, expand its projects, pay dividends and etc.A mining company can not survive by breaking even for an extended period. It needs profits to sustain its business model of replacing reserves as well as dealing with rising costs in the future. I have read where individuals believe the mining companies can produce silver at much lower prices while hiding profits through supposed tax write-offs such as depletion, depreciation and amortization (D,D & A).
I am not going to get into details on D, D & A, but I will make a brief point by using Pan American Silver as an example:
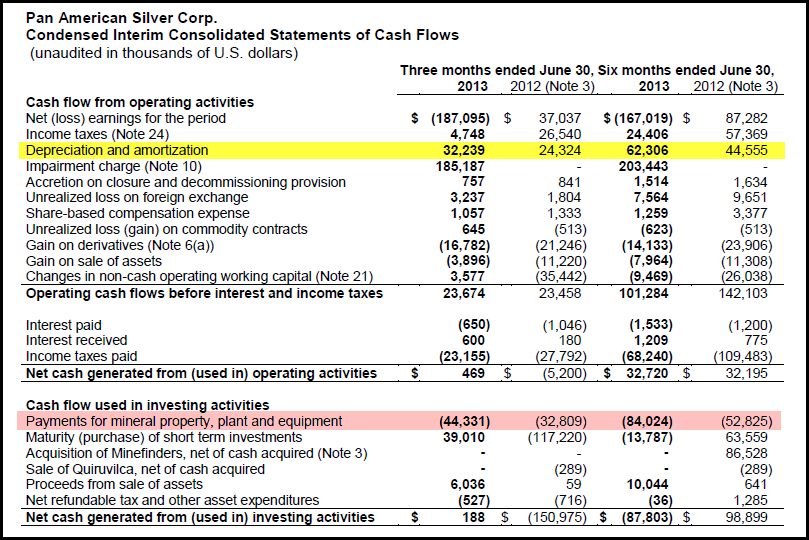
The yellow highlighted area shows the depreciation & amortization (D & A). If we just look at Q2 2013, you will see that Pan American recorded a $32.2 million for D & A. That $32.2 million figure was not an actual cash expense but an estimated operational expense that denotes the decline in value of the mine, plant & equipment.
If you go down to the red highlighted area, you will see that they made payments of $44.3 million for mineral property, plant and equipment. According to their segmented information on capital expenditures for Q2 2013, Pan American actually spent $46.8 million on their seven mines during the second quarter.
While that $32.2 million in depreciation & amortization is not an actual operational expense for the quarter, that $46.8 million in CAPEX sure is. Basically, Pan American spent more on CAPEX in Q2 than it recorded for its D & A. Here we can see that maintaining mines, plant and equipment is an expensive affair for the mining industry.
Even though my estimated break-even for the top 12 primary silver miners was an average of $25.26 an ounce, at least five in the group would lose money at that price. Moreover, these miners need to make profits to sustain their business in the future. I would imagine a price of at least $30 an ounce would be needed by the group and even higher for the marginal producers if they want to stay in business for the longer haul.
Lastly, as the primary silver miners are presently struggling with manipulated low prices, I believe market conditions will turn around, making this industry one of the most successful investments in the future.
More on that in upcoming articles.
2013年6月13日星期四
SILVER COSTS: Much Higher Than Most Realize
There still seems to be huge misunderstanding by many investors as to
what it really cost to mine silver. I still come across individuals
and analysts who believe the price of silver is overvalued because it is
so cheap to mine the metal. Part of the reason for this FALLACY, especially from bearish silver analysts, is due to the reporting of CASH COSTS.
It doesn’t matter which mining company report you look at, just about all of them list what their cash cost is to produce their main metal. Furthermore, the Silver Institute lists the primary silver miner’s cash cost per ounce from the Annual World Silver Survey on its website for all to see.
According to the Silver Institute:
When the World Silver Survey calculates the primary silver miner’s cash cost, they only use a sample portion. Let’s just say, this sample size is less than two-thirds of the silver produced from the primary miners. Even though the folks (GFMS, Reuters) who publish the World Silver Survey do a good job calculating the cash cost for the primary silver mining industry, we will find out how useless it can be in determining the profitability of a mining company.
Let’s take a look at Excellon Resource’s Q1 2013 report on their cash cost:
 According to Excellon, they produced silver at a cash cost of $6.96
an ounce in Q1 2013, up from $5.67 in the same period in 2012. As you
can see they took their cost of sales ($5,963,000) and
then added back Depletion, depreciation, amortization, inventory changes
and by-product credits. Thus, they had a cash operating cost of only $2,173,000 which was divided by silver ounces produced (312,167 oz) to get their $6.96 cash cost.
With this sort of low cash cost structure, Excellon should be making excellent profits. However, if we look at their Financial Statement for Q1 2013 we have the following:
 Even, with such a low cash cost of $6.96 an ounce, Excellon stated a $601,000 net income loss for Q1, 2013 compared
to a $5.6 million net gain in previous period. If we went by
Excellon’s change in cash cost year over year, this would be the result:
First… we will notice, that revenues on the top of the table declined more than $3 million. That alone wipes off $3 million from their bottom line.
Second…. their Cost of Sales increased from $4.8 million to $5.9 million, year over year. So, that knocks off another $1+ million of net income.
Third… if we look at their exploration cost (in blue), we will see that it increased nearly $2.8 million compared to the same quarter last year. That erases at least another $2.5 million from their bottom line.
Without those three factors, Excellon would have shown a positive $6.5 million net income gain instead of a loss. As you can see, Excellon’s cash cost of $6.96 does not provide the investor a clue to the profitability of the company.
If you look at the table below there are TWO BIG Culprits that destroyed Excellon’s profitability compared to the same quarter a year ago.
 The first big problem was the decline in silver grade year over
year. At the top of the table you can see that the average ore grade
in Q1 2013 was 591 g/t (grams/tonne) compared to 949 g/t, Q1 2012. Not
only did Excellon suffer a 38% decline in grade, the also processed an
addition 1,250 tonnes of ore. Here we can see that Excellon had higher
costs to produce 125,000 less ounces of silver.
The next big hit came from their $6.30 decline in the price of silver they received shown at the bottom of the table. I highlighted the green areas to show the zinc and lead by-product data. We can see that zinc and lead were not part of the problem in profitability as the price of lead was the same while zinc fell half of what silver did.
Furthermore, both lead and zinc had higher production and sales. The practice of mining companies subtracting their by-product credits from their silver mining costs to show a LOW CASH COST obfuscates the TRUE BOTTOM LINE PICTURE.
Total costs to mine silver are much higher than the industry is putting out in their financial statements. With the current low price of silver below $22, the majority of primary silver producers are losing a great deal of money. According to my calculations of my top 12 silver miners only ONE is making a little money.
Even though the mining stocks have declined substantially over the past few years, once the broader stock markets collapse, money will be forced to move into hold physical assets to protect their wealth. The mining stocks may turn out to be some of the best assets to own in the next several years.
http://srsroccoreport.com
It doesn’t matter which mining company report you look at, just about all of them list what their cash cost is to produce their main metal. Furthermore, the Silver Institute lists the primary silver miner’s cash cost per ounce from the Annual World Silver Survey on its website for all to see.
According to the Silver Institute:
Primary silver mine supply grew by 1 percent to account for 28 percent of global silver mine output. Mexico was the world’s largest silver producing country in 2012, followed by China, Peru, Australia and Russia. Primary silver mine cash costs rose to $8.88 an ounce, reflecting higher prices for labor, electricity, and maintenance charges.So, it seems as if the primary miners produced silver at $8.88 cash cost an ounce in 2012. This was up over 2011. Here are the cash cost figures for the past 3 years (World Silver Survey’s, Silver Institute & Kitco):
2010 = $5.47 (avg. spot price = $20.19)With low cash costs such as these, the silver miners should be raking in the dough and stating huge profits. However, a percentage of these primary silver miners are actually stating net income loses even at realized prices of $28-30 an ounce.
2011 = $8.11 (avg. spot price = $35.12
2012 = $8.88 (avg. spot price = $31.15)
When the World Silver Survey calculates the primary silver miner’s cash cost, they only use a sample portion. Let’s just say, this sample size is less than two-thirds of the silver produced from the primary miners. Even though the folks (GFMS, Reuters) who publish the World Silver Survey do a good job calculating the cash cost for the primary silver mining industry, we will find out how useless it can be in determining the profitability of a mining company.
Excellon Resources Very Low Cash Cost & Net Income Loss??
I selected Excellon Resources as they are a perfect example to show how a company can state a very low silver cash cost while reporting a net income loss. Now, I am not singling out Excellon or putting out negative information about the company, rather Excellon is actually a pretty good company that has the highest grade silver mine in Mexico.Let’s take a look at Excellon Resource’s Q1 2013 report on their cash cost:
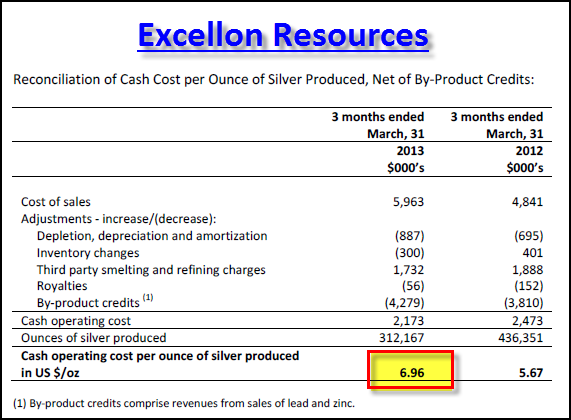
With this sort of low cash cost structure, Excellon should be making excellent profits. However, if we look at their Financial Statement for Q1 2013 we have the following:
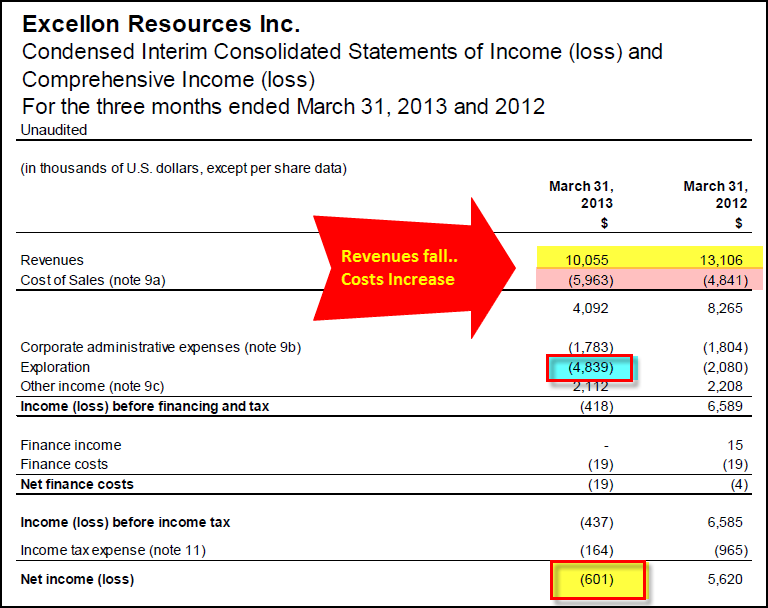
CASH COST Change: $6.96 – $5.67 = +$1.29 ozSomething seems fishy. How could Excellon’s cash cost increase only $1.29, but their net income decline more than $6 million year over year?
First… we will notice, that revenues on the top of the table declined more than $3 million. That alone wipes off $3 million from their bottom line.
Second…. their Cost of Sales increased from $4.8 million to $5.9 million, year over year. So, that knocks off another $1+ million of net income.
Third… if we look at their exploration cost (in blue), we will see that it increased nearly $2.8 million compared to the same quarter last year. That erases at least another $2.5 million from their bottom line.
Without those three factors, Excellon would have shown a positive $6.5 million net income gain instead of a loss. As you can see, Excellon’s cash cost of $6.96 does not provide the investor a clue to the profitability of the company.
The Cash Cost Disclaimer
Anytime a company reports their cash cost in their financial reports they include the following explanation (I label it as a cash cost disclaimer) of their cash cost. This one is from Excellon’s Q1 2013 MD & A Report:Cash operating cost, net of by-product credits, is provided as additional information as is non-IFRS measure that does not have a standardized meaning. This measure should not be considered in isolation or as a substitute for measures of performance prepared in accordance with generally accepted accounting principles and is not necessarily indicative of operating expenses as determined under generally accepted accounting principles.IFRS stands for International Financial Reporting Standards and GAAP is the generally accepting accounting principles. Basically, cash costs are not indicative of operating expenses and are not in accordance with either the IFRS & GAAP.
What Caused Excellon to Lose Revenues & Profits?
So now that we know Cash Costs are bogus in determining the profitability of a company, let’s look at what happened to Excellon’s balance sheet.If you look at the table below there are TWO BIG Culprits that destroyed Excellon’s profitability compared to the same quarter a year ago.
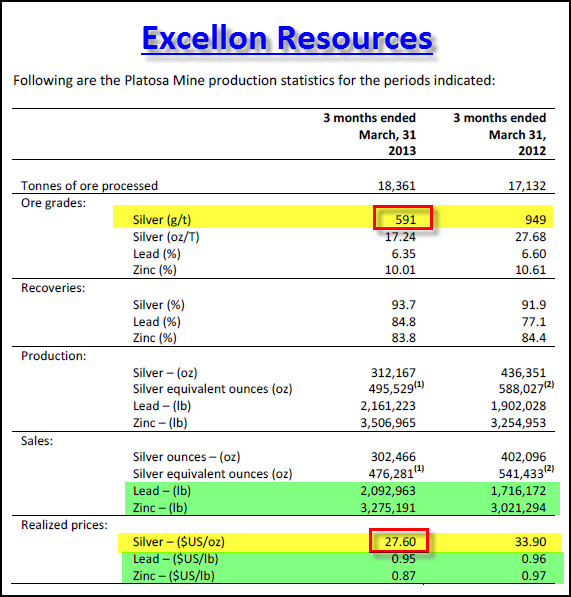
The next big hit came from their $6.30 decline in the price of silver they received shown at the bottom of the table. I highlighted the green areas to show the zinc and lead by-product data. We can see that zinc and lead were not part of the problem in profitability as the price of lead was the same while zinc fell half of what silver did.
Furthermore, both lead and zinc had higher production and sales. The practice of mining companies subtracting their by-product credits from their silver mining costs to show a LOW CASH COST obfuscates the TRUE BOTTOM LINE PICTURE.
What was Excellon’s Estimated Silver Break-Even Price
There are several ways to get to a pretty good estimated break-even price for a silver miner. You have to use either Net Income or Adjusted income and divide it by the Silver ounce sold during the quarter. Then you add or subtract that figure to their Realized Price that quarter.-$601,000 / 302,466 = -$1.99So, we can see that Excellon needed $29.59 an ounce silver to break even that quarter. This is a very simple and easy way to get an estimated break-even, however there are other more detailed methods which will be discussed in future posts.
$27.60 + $1.99 = $29.59 Net Income Break-Even
Total costs to mine silver are much higher than the industry is putting out in their financial statements. With the current low price of silver below $22, the majority of primary silver producers are losing a great deal of money. According to my calculations of my top 12 silver miners only ONE is making a little money.
Even though the mining stocks have declined substantially over the past few years, once the broader stock markets collapse, money will be forced to move into hold physical assets to protect their wealth. The mining stocks may turn out to be some of the best assets to own in the next several years.
http://srsroccoreport.com
2013年6月10日星期一
礦產白銀的“全成本”

白銀生產的真實成本究竟是多少,這也是一筆眾說紛紜的糊塗賬。根據“世界白銀調查”公佈的“現金成本”數據是:2009年,$5.02;2010年$5.47;2011年$7.25;2012年$8.88。
如果這一計算方法合理的話,那麼在2012年白銀價格大部分時間高於$30的情況下,白銀生產企業應該是每盎司暴賺20美元以上。我們來看看世界最大的10家白銀主營生產企業的2012年財報匯總:

實際上,10大白銀生產商2012年第3季度的淨收入同比下降了78%,當然它們還是處於盈利狀態,平均每盎司白銀淨賺2.53美元,而同期銀價在28美元左右。由此可以推算最大的10家白銀生產商的平均成本大約為25.5美元左右。
這種方法我們可以稱為“淨收益”計算法,這是主營白銀生產的10大企業的情況。但是,白銀還有許多伴生礦,比如銅和鋅,它們伴生白銀的綜合生產成本也需要考慮,所以我們還需要更廣泛的白銀生產數據來進一步推算白銀的生產成本。
Hebba投資公司將所有公開上市的白銀生產企業(包括所有主營白銀的生產商)的財務報表進行了匯總分析,採用“全成本”計算法,將財務、稅負、債務利息、現礦深度發掘、新礦勘探等成本綜合考慮,並剔除了衍生品對沖、資產減記、其它投資盈虧(與白銀生產無關),最後再把伴生礦(如銅和鋅)產出折算為白銀,這樣就計算出白銀生產企業最接近實際運營狀態的“全成本”了。

我們發現2012年第4季度全世界所有上市白銀企業(總產量7000萬盎司,約佔全球總產量的10%,具有相當的代表性)的每盎司白銀生產的“全成本”為23.04美元,2011年同期為20.80美元,成本同比增長10.8%。如果考慮資產減記的成本增加,這2012年第4季度白銀“全成本”為25.74美元。
這與10大主營白銀企業的財報分析結果大致吻合。無論採用哪種方法計算,都遠遠高於“現金成本”計算法的8.88美元。
現在的白銀價格為21.74美元,已經低於白銀生產的“全成本”3美元以上。如果這個價格持續時間足夠長,那麼我們將會看到全球白銀生產商大面積虧損的消息。結果很可能就是關閉礦山,減少生產,全球白銀礦產銀產出萎縮(2012年增長了4%)。
從需求方面看,今年四月金銀價格大幅下跌以來,黃金脫銷搶占了媒體的頭條,其實白銀銷售也同樣強勁。

美國財政部銀幣銷售量是全世界白銀投資的一個指標。今年5月銀幣銷量達345.8萬盎司,今年累計銷量2176.8萬盎司,比歷史同期的最高紀錄高出了200萬盎司。
加拿大皇家造幣廠今年第一季度的銀幣銷售同樣打破了歷史最高紀錄(僅公佈季度報告),銀幣銷售量達660萬盎司,比去年同期高出65%。
美國與加拿大都是白銀生產大國,2012年美國年產白銀3400萬盎司,加拿大1700萬盎司,兩者總共生產白銀5100萬盎司。以今年兩國銀幣銷售規模預估,僅兩國銀幣銷售規模就將達到7200萬盎司(美國4600萬,加拿大2600萬)。在不計入白銀ETF和銀條銷售的情況下,美加今年至少需要進口2100萬盎司投資白銀。
目前白銀價格已低於生產成本,而且成本年遞增10%左右(“感謝”量化寬鬆所帶來的各種成本增加),同時白銀不像黃金,其工業消耗量巨大,庫存僅相當於1年的產量,存量極少。價格如果持續低於成本則供應減少實屬必然,最終供求關係的壓力將迫使銀價上漲。
2013年4月19日星期五
黃金礦主大虧損:市值縮水1690億美元,15%生產商無法獲利
正如我早前提到,黃金白銀始終 是勞動力的成品,是要成本,
在當今天量的紙幣下,生產成本會下降嗎?
如今黃金期貨價為US1400樓下,已有15%的礦商無利可圖,
部份礦山亦要面臨關閉.

在金價本週創下30年最大跌幅過後,15%的黃金礦主們已無利可圖,部分礦主們面臨關閉礦山甚至停業風險。
據彭博社,自從金價2011年觸頂以來,富時金礦指數(FTSE Gold Mines Index)已下跌58%,金礦企業市值因此縮減1690億美元。富時金礦指數追踪了全球27家最大黃金生產商,包括排名前兩位的巴里克黃金集團(Barrick Gold Corp.)和紐蒙特礦業公司(Newmont Mining Corp.)。
而在富時金礦指數下跌58%的同時,MSCI世界指數攀升了22%。
黃金期貨價格週一重挫9.3%,創下自1980年3月以來最大單日跌幅,最低曾觸及每盎司1,361.10美元。野村控股稱,這使得金價逼近約在1,200美元的平均生產成本。巴克萊資本也表達了類似觀點。
野村黃金分析師Tyler Broda說,在當前價格水平,可能有15%的黃金生產商無法獲利。他還預計,黃金今年可能跌至每盎司1000美元。
澳大利亞黃金生產商Kingsgate Consolidated Ltd. CEO Gavin Thomas說:
任何在過去3-4年裡未聚焦於效率和成本的公司,都將在這個市場破產。
最新唱衰黃金的是惠譽。這家法國評級機構週四說,金價將繼續下跌,南非礦主們風險敞口最大。來自惠譽的報告:
南非礦主們在金價下跌的風險面前敞口最大,因為生產成本已經很高,而且還在快速上升。儘管如果對歐元區的擔憂繼續加深,黃金價格可能因此快速反彈,但我們的基準情境是,金價將在未來兩到三年內下跌。
有關塞浦路斯可能出售大量黃金的報導或引發了金價的急劇下跌,但我們認為,這代表了對黃金情感的轉變。隨著投資者們紛紛退出黃金市場,這類轉變通常具有雪球效應。
但可以肯定的是,即便是在目前價格下,一些企業仍將能夠獲利。今年第一季度,巴里克的黃金生產成本(包括從勘探到矸石搬遷在內的一切費用)為每盎司972美元;紐蒙特為1,192美元。
此外,金價也並非沒有反彈可能。據彭博社調研,受訪29名分析師給出的預測均值是,今年的現貨黃金平均價格料在每盎司1,717美元。
2013年4月18日星期四
必讀-----更大金融危機醞釀中?

信報研究部
近日金融市場的焦點,必離不開金價(連同個別金屬及商品價格)暴瀉的走勢。金價(和其他金屬價格)出現如此急挫,背後因由眾說紛紜。無論如何,經過金價如此暴瀉後,衍生一些疑團有待解答。今期研究部與讀者逐一解構。
金價於上周五開始急瀉,在短短兩個交易日已急挫逾200美元(近13%),周一的跌幅更創下逾30年以來最大單日跌幅。
金價(及其他貴金屬價格)跌勢之急且快,確實令人咋舌。對數字有興趣的讀者可留意,根據過去20年的數據統計,金價過去5日的跌幅較平均高近7個標準差
(standard
deviation;即是7-Sigma事件),根據「純統計學理論」,發生的機會約為五萬億分之一!可見近日金市的跌勢是如何空前和誇張。
急挫原因錯綜複雜
造成金價急挫,顯然牽涉到孖展斬倉活動(margin
calls),至於是由什麼因素造成是次金價恐慌拋售,則眾說紛紜,有指塞浦路斯沽金救亡(也間接加速投資者擔憂其他資不抵債的歐羅區國家加入沽金行
列)、JGB價格異常波動,基於風險管理迫使金融機構透過沽金補充資本(見4月16日「市評」),甚至有指與網上Bitcoins泡沫爆破有關等等。
姑勿論背後的因由,有一點可以肯定的是,自2011年9月金價每盎斯高見1921美元,隨後大部分時間走勢反覆偏軟,惟期內卻持續有資金流入金市(黃金ETF持金量不斷創新高;【圖1】),而期間美股的表現,明顯給比下去(見【圖1】金價/標普500指數比率反覆向下)。

經過逾一年相對較差的表現後,投資者似乎開始失去耐性,去年底已看到逐步減持黃金投資比重迹象(見【圖1】ETF持金量於去年底見頂,且於今年2月中開始跌幅加劇)。故當沽售壓力逐步加大,最終觸發金價近日愈跌愈急的景況。
金價(及其他貴金屬價格)近日的急挫,有四個疑團值得留意和討論:
其一,更大的金融危機將發生?近日金價急挫,已令其期權的引伸波幅顯著飆升。1個月金價引伸波幅抽升至27%的18個月新高,罕有地遠高於標普500的VIX指數達13個百分點之巨【圖2】。

以往金價引伸波幅遠遠拋離VIX指數並不常見,之前兩次出現如此情況,分別是2006年次按危機開始引爆和2008年雷曼爆煲。兩者均是出現交易對手風險
(counterparty risk),進而引發新一輪的金融危機。那麼今次金價波幅顯著抽升,是否意味新一輪的金融危機正在醞釀中?值得留意。
此
外,金價於今年2月20日發出「死亡交叉」訊號(即50天移動平均線由上而下跌穿200天線;見2013年2月21日本欄分析),至今「期間最大跌幅」約
達15%。自1991年至今的歷次(13個)「死亡交叉」訊號中,錄得如此「最大跌幅」只曾出現過三次(不包2月21日的訊號),時間分別發生在上世紀
90年代末亞洲金融風暴和2008年下旬雷曼爆煲,剛好也是出現金融危機期間。是否巧合不得而知,但投資者對此不容掉以輕心。
全球步向衰退風險增
其
二,金價等商品價格近日暴瀉,意味環球經濟再度放慢(或步入衰退)?無疑商品價格的變化,與經濟表現有十分密切的關係(這點並不難理解,以銅價為例,由於
銅廣泛地應在工業生產層面上,銅價的變化某程度可作為經濟盛衰的領先指標;【圖3】)。而近日多個金屬商品價格下瀉,無疑反映環球經濟增長減慢(或步入衰
退)的風險正在加大中。

然而,銅價近期的表現,並沒有如金價和銀價般出現顯著急瀉的情況,表現明顯相對地較佳。事實上,金價/銅價的比率近日已跌至近兩年以來的新低【圖3】;故環球經濟是否再度步入衰退(或增長放慢),相信還有待進一步觀察確認。
其三,金價步入熊市?經過近日的急挫後,金價已由高位下跌逾兩成,故有分析指出,金價確認步入熊市。是耶?非耶?金市始終跟股市屬兩個不同類別的市場,是否同樣可以利用高位回落兩成的門檻,來判別金價步入熊市?
事實上,自金價於2000年踏入明顯的上升周期後(牛市),曾經於2006年和2008年均由高位回落逾兩成【圖4】,隨後再度回升並再創新高。

故此,僅從金價從高位回落兩成而推論黃金步入熊市或過於粗疏;當然,風險上升的事實卻毋庸置疑。
最後,金價近日暴瀉至1300美元水平後,黃金是否仍有「保值」的作用呢?暫且撇除金價是否已確認熊市,及現時恐慌拋售潮是否已完結,這很大程度取決於在央行的量寬(印鈔)行動下,央行資產規模與金價的關係能否繼續保持,最終會否觸發通脹惡化。
與央行量寬關係密切
正如2月21日本欄分析曾指出,自金融海嘯後,金價走勢與央行(聯儲局或四大發展國家央行合併)的資產規模(即量寬規模)一直有密切關係【圖5】,雖然近月來這關係變得鬆散(尤其金價與聯儲局資產規模近日呈背馳走勢),但這關係是否已脫鈎仍然有待觀察。

若然兩者亦步亦趨的關係仍然存在,在目前央行繼續大量寬的環境下(僅是美、日兩國量寬行動,已令今年底合計央行資產規模急漲約2萬億元,或逾兩成之巨),最終很大機會或再度推高金價。
退一步看,金融海嘯後央行資產規模與金價關係密切,反映投資者相信央行不負責任的「印鈔」行動,最終會觸發通脹惡化。故此,若此情況最終出現,投資者趁低吸納黃金(或白銀等)作保險,相信仍是可取的做法。
無論如何,值得補充的是,經過連日來的急挫後,金價的14周RSI已跌至嚴重超賣的水平。
其次,大型金礦公司「總開採成本」每盎斯也要1200至1300美元,金價於現水平距離開採成本已相距不遠
(註:白銀的總開採成本約為25美元,現價已跌穿開採成本價),看來再下跌的空間最多只有10%至15%。
2013年4月16日星期二
華爾街的陰謀 VS 市場經濟:金銀最後一戰?
朱冠華
虛擬經濟,用紙交易的金銀價格傷害不到我們這些實物儲蓄者。放長遠來看,你絕對是贏家。因為虛擬經濟只能短暫影響到實體經濟,卻無法永遠。
黃金期貨價格持續大幅下跌,為何金飾沒大幅跟跌?
因為這是實物。畢竟每件珠寶的設計與品牌帶來的附加價值不同。另外還要考量到珠寶生產當下的製造與運輸等成本,故難因黃金期貨價格一時的崩跌而在之後出現相應的調降幅度。
當然,短期來看,期貨價格下跌還是可能影響實物的。例如我們投資型的金條銀條,金幣銀幣的價格都大幅度下跌。(我好恨自己沒錢入貨)
但是,他可以跌破成本價嗎?期貨價格可以永遠低於成本價嗎?
根據高盛銀行預測報告指出,黃金價格一旦跌破1200美元,許多黃金生產商將難以為繼,可能讓金礦業在2017年後,遭遇嚴重風險。
摩根自然資源基金經理人薩頓(James Sutton)亦告訴CNBC說:「我們認為讓黃金礦業遭遇困境的水平是在1200美元。」
竟然如此,為何放空黃金的高盛銀行卻還預測自2017年以後的黃金長期價格預測為1200美元?
這不合常理。如果是金價低於成本價,金礦商就會減產,黃金會因為供應減少而價格上漲。因為黃金白銀本來就是稀少金屬,是不可能出現爛價格的。更何況,高盛說黃金自2017年以後的價格為1200美元,難道高盛有天眼通?可以看到這麼遠?
再看高盛說下去,我笑了!我終於明白華爾街的陰謀了!
高盛認為既然未來金價如此低,所以建議金礦生產商為2013年及爾後,鎖定目前的黃金價格。
鎖定目前的黃金價格你知道是怎麼回事嗎?
就是要金礦生產商用一些金融衍生產品,例如期貨,來對沖黃金的下跌。也就是要金礦生產商買黃金下跌,只要黃金下跌,他們就能從期貨上賺到錢來彌補實物生產的損失。而這些還沒挖出來的黃金則預先賣給華爾街的貴金屬公司,如JP Morgan和高盛自己。
這種手法就是過去華爾街打壓黃金的武器之一,不過這武器自從搞垮一家南非金礦公司後,金礦公司就已經大量減少,現在幾乎都不搞了!
還有,通過這方法華爾街可以預先得到黃金,充實他們的庫存。我推斷,這也許是幫助美國政府還黃金給德國有關吧!
美國要分7年時間還德國部分幾百噸的黃金,分7年也意味注德國的黃金被美國私吞了!打壓金價可以降低還給德國的成本。
但是,恐怕現在不同以前了!華爾街這招的效果恐怕大不如前了!
1980-2001年,華爾街之所以可以打壓金價20年,關鍵原因就是當時黃金生產成本比期貨價格還要低。雖然我得不到數據獲知當時的價格,不過根據2000年的生產成本推斷,1980年的生產成本應該不會高過200美元一盎司。
而當時金價從850美元一盎司價格下跌,之後20年在300-500美元盤整,因為價格仍高於成本價,所以華爾街可以讓金礦公司不大量減產下繼續提供黃金,讓歐美中央銀行大量傾銷黃金。
但是,現在不同過去了!黃金生產成本和期貨價格沒有多少空間差距,華爾街想要靠打壓黃金期貨價格低於成本價,誘使黃金礦商重新對沖金價,幫助華爾街打壓金 價,我仍為不大可能。更何況,黃金實物的需求仍維持高位,各國中央銀行並不會為金價的下跌而停止購買,因為他們是買來收的。比起黃金,他們更擔心美元。
如果華爾街強硬將黃金期貨價格打壓到生產成本以下,我不知道其他金礦商的CEO會怎樣想。如果是我,我乾脆繞過黃金期貨交易市場,當這市場根本不存在,反正期貨市場根本就不能反映真實的商品價格,因為它是用紙交易來決定價格,而非實物交易。
最後,實物市場會自己走自己的路。也許你會看到期貨金價500美元,實物價格5000美元的情況。
自這幾天金銀期貨市場大屠殺,但是Comex的黃金庫存只是增加一點點,而白銀庫忖則更加減少(截至15/4/2013)
剛才我打電話去Nubex,問他為何在金銀大跌的這幾天,為何他們的金銀存貨會減少如此多?
對方回答因為出現更多的買潮,甚至連Pre-order也沒有貨了!
在2011年金價從1910暴跌時,GoldSilver.com的麥克馬尼龍和幾家美國主要的貴金屬交易商,出現3個月拿不到黃金新貨的情況,白銀只有一款可以拿到而已。
明白嗎?為何我們要實物!
下文是金甲 Jo 兄 文章 轉載!
實物與期貨較量──金市大戰
金價繼續大跌,發生甚麼事?似乎有人心急如熱鍋上螞蟻,要盡快把金價打下去,嚇退持有實物者,令他們盡快沽貨!看看近期Comex的實金儲備,嚇死人!儲 備急速減少,其中又以超級大戶JP Morgan的持貨量,由1月至今,大幅減少!即是說有人正向JP Morgan發動提貨戰!
甚麼人呢?其中馬田大師在網誌中提到,歐洲有人從Comex倉庫提金: http://armstrongeconomics.com/2013/04/14/gold-inventories-shifting-to-europe/
另外,早幾日,Kingworldnews提到來自上海的提貨者單單於3月就提走了283噸: http://kingworldnews.com/kingworldnews/KWN_DailyWeb/Entries/2013/4/12_Maguire_-_Over_500_Tons_Of_Paper_Gold_Sold_In_Takedown.html
Maguire:Deliveries in Shanghai alone in March were 283 tons. In the eight trading days of April, we have seen another 117 tons (of gold) delivered. Today was another 20 tons delivered. So what we are looking at here is over 400 tons (of gold) in less than a month and a half.
另外市場貨源短缺,有人被夾得很慘:
http://kingworldnews.com/kingworldnews/KWN_DailyWeb/Entries/2013/4/13_Haynes_-_Were_On_The_Verge_Of_Major_Gold_%26_Silver_Shortages.html
歐洲可能將有大事發生!如此提貨,如果提貨者繼續,或大眾持續買入實金,有一個可能出現,黃金期貨市場關門!持有所有Paper黃金者,包括期金,倫敦 金,紙黃金要小心!大戰將會繼續,請坐穩!如有實貨市場動向,歡迎報告!小弟這幾日會入貨!希望趕得及買!(今天仍分身不下)
結語:
我推測,這也許是華爾街 vs 市場經濟,或者紙金銀 vs 實物金銀 的最後一場大戰了!
如果華爾街和紙金銀戰勝,金銀價格可能又會被壓制幾年。但是,我還是選擇市場經濟和實物金銀會取得最後勝利。
因為我從來沒有聽過紙幣可以戰勝金銀的案例。
就像你下個賭注,假如世界末日,你認為人類存貨的機率高,還是蟑螂存活的機率高?
讓我們看下去,如果實物庫存還是繼續留出,華爾街就大條了!
附上:金銀生產成本資料
很多人根本搞不清楚金銀的生產成本,因為金銀礦公司從不提供數據,只能有各種機構自行調查。
通常,我們在年報中看到的是不全面的現金成本(Cash Costs)。
下圖是全球最大的金礦公司Barrick的cash costs,請注意,是否出高速成本增長?這漲幅是否提供了黃金價格上漲合理的依據?


金價下跌刺激金飾銷售,旺角幾乎所有金鋪的黃金櫃檯都被顧客逼爆,店員應接不暇,與周圍其他商品專櫃的門庭冷落形成鮮明對比。有顧客甚至花半天時間精心挑選各款黃金飾品,更有許多顧客在旺角多家不同品牌的金鋪出出入入。店員向記者透露,3天前入鋪光顧的購金客就明顯增多。
《星島日報》報導,現場所見,詢問和購買黃金首飾的以大陸客居多,許多大陸遊客表示被金價下跌吸引,紛紛攜親友赴港買金,一是為自用,二是為保值,多數人對黃金未來的升值潛力仍非常有信心。
來自廣州的胡先生表示,受到金價連日下跌的吸引,過來香港給孩子買金手鐲。他認為黃金始終屬於稀有金屬,不可能一直下跌,相信金價總有一天會回升。來自深圳的黃小姐指,見到金價下跌,便告訴親友,一齊來港買金吊墜,相信就算跌價也不會跌到太低。
錢先生自稱來自北京,本來只是來香港出差,恰逢金價下跌這個好時機,就買個金手鐲給女友,相信黃金日後會增值。來自深圳的閻小姐表示,自己本來就有 經常來港購金的習慣,但近來金價跌了很多,便趁此機會買多些;又表示完全不擔心金價會繼續下跌。她同丈夫和母親來港不過一日,已購買3萬多元的金飾。
周大福發言人指出,集團目前仍然是以賣出黃金為主,金價大跌之後,雖然擔心金價續跌而沽出黃金的人數有所增加,但增加更多的是前來買金客人,其中有自用也有投資。
另外,金價暴跌令K金回收也受影響,香港珠寶玉石廠商會理事陳日強估計,金價下跌令回收金生意減少約1成。K金回收站負責人陳先生估計,近兩日整體 回收生意額跌約3成,查詢電話亦由高峰期的近百個跌至近日的10多個,當中以足金金器跌勢最明顯,因不少客人以為K金價值低,願意以低價割愛,反而變賣足 金金器的態度較審慎,他又預期未來金價仍有機會下調1成。
最新消息:芝加哥商業交易所(CME)表示,將在周二收盤提高黃金、白銀與其它貴金屬期貨保證金要求。
反正,我看死華爾街拖不了多久,10年內全球金融體系和美元本位必定出現大地震。
ALL US WHOLESALERS SOLD OUT OF ALL PHYSICAL SILVER!!!
April 15, 2013 By The Doc 78 Comments
Tweet
*UPDATE: ALL US WHOLESALE SUPPLIERS ARE NOW SOLD OUT OF EVERY OUNCE OF PHYSICAL SILVER & HAVE SUSPENDED ALL SALES!
SDBullion.com has closed due to lack of ANY AVAILABLE SILVER!
Two of the largest wholesale suppliers in the US, including Amark and CNT, who is the supplier of gold blanks to the US Mint for Gold Eagles, and is a registered COMEX depository, HAVE JUST SOLD OUT OF ALL PHYSICAL SILVER!!!
AND……IT’S GONE!!!!!
In the face of an EPIC TSUNAMI of gold and silver sales today as the cartel hammered the price of silver down over 12%, and off $6 from Friday’s open, we have just been informed at SDBullion upon trying to place a large inventory order that BOTH AMARK & CNT ARE SOLD OUT OF EVERY LAST OUNCE OF PHYSICAL SILVER!!!
Apparently the fact that one of the largest wholesale suppliers in the US is SOLD OUT, while simultaneously the 2nd largest silver mine in the US is offline perhaps permanently is of absolutely no consequence to the paper dumping cartel bullion banks.
Bullion bank silver shorts are most likely covering in mass RIGHT NOW, and we’ll soon have the data to make the case. Many have speculated that the bullion banks are going to switch to a net long position. There couldn’t be a better time to do just that given that at $22/oz, pretty much all existing shorts taken out before this week will be in the money.
虛擬經濟,用紙交易的金銀價格傷害不到我們這些實物儲蓄者。放長遠來看,你絕對是贏家。因為虛擬經濟只能短暫影響到實體經濟,卻無法永遠。
黃金期貨價格持續大幅下跌,為何金飾沒大幅跟跌?
因為這是實物。畢竟每件珠寶的設計與品牌帶來的附加價值不同。另外還要考量到珠寶生產當下的製造與運輸等成本,故難因黃金期貨價格一時的崩跌而在之後出現相應的調降幅度。
當然,短期來看,期貨價格下跌還是可能影響實物的。例如我們投資型的金條銀條,金幣銀幣的價格都大幅度下跌。(我好恨自己沒錢入貨)
但是,他可以跌破成本價嗎?期貨價格可以永遠低於成本價嗎?
根據高盛銀行預測報告指出,黃金價格一旦跌破1200美元,許多黃金生產商將難以為繼,可能讓金礦業在2017年後,遭遇嚴重風險。
摩根自然資源基金經理人薩頓(James Sutton)亦告訴CNBC說:「我們認為讓黃金礦業遭遇困境的水平是在1200美元。」
竟然如此,為何放空黃金的高盛銀行卻還預測自2017年以後的黃金長期價格預測為1200美元?
這不合常理。如果是金價低於成本價,金礦商就會減產,黃金會因為供應減少而價格上漲。因為黃金白銀本來就是稀少金屬,是不可能出現爛價格的。更何況,高盛說黃金自2017年以後的價格為1200美元,難道高盛有天眼通?可以看到這麼遠?
再看高盛說下去,我笑了!我終於明白華爾街的陰謀了!
高盛認為既然未來金價如此低,所以建議金礦生產商為2013年及爾後,鎖定目前的黃金價格。
鎖定目前的黃金價格你知道是怎麼回事嗎?
就是要金礦生產商用一些金融衍生產品,例如期貨,來對沖黃金的下跌。也就是要金礦生產商買黃金下跌,只要黃金下跌,他們就能從期貨上賺到錢來彌補實物生產的損失。而這些還沒挖出來的黃金則預先賣給華爾街的貴金屬公司,如JP Morgan和高盛自己。
這種手法就是過去華爾街打壓黃金的武器之一,不過這武器自從搞垮一家南非金礦公司後,金礦公司就已經大量減少,現在幾乎都不搞了!
還有,通過這方法華爾街可以預先得到黃金,充實他們的庫存。我推斷,這也許是幫助美國政府還黃金給德國有關吧!
美國要分7年時間還德國部分幾百噸的黃金,分7年也意味注德國的黃金被美國私吞了!打壓金價可以降低還給德國的成本。
但是,恐怕現在不同以前了!華爾街這招的效果恐怕大不如前了!
1980-2001年,華爾街之所以可以打壓金價20年,關鍵原因就是當時黃金生產成本比期貨價格還要低。雖然我得不到數據獲知當時的價格,不過根據2000年的生產成本推斷,1980年的生產成本應該不會高過200美元一盎司。
而當時金價從850美元一盎司價格下跌,之後20年在300-500美元盤整,因為價格仍高於成本價,所以華爾街可以讓金礦公司不大量減產下繼續提供黃金,讓歐美中央銀行大量傾銷黃金。
但是,現在不同過去了!黃金生產成本和期貨價格沒有多少空間差距,華爾街想要靠打壓黃金期貨價格低於成本價,誘使黃金礦商重新對沖金價,幫助華爾街打壓金 價,我仍為不大可能。更何況,黃金實物的需求仍維持高位,各國中央銀行並不會為金價的下跌而停止購買,因為他們是買來收的。比起黃金,他們更擔心美元。
如果華爾街強硬將黃金期貨價格打壓到生產成本以下,我不知道其他金礦商的CEO會怎樣想。如果是我,我乾脆繞過黃金期貨交易市場,當這市場根本不存在,反正期貨市場根本就不能反映真實的商品價格,因為它是用紙交易來決定價格,而非實物交易。
最後,實物市場會自己走自己的路。也許你會看到期貨金價500美元,實物價格5000美元的情況。
自這幾天金銀期貨市場大屠殺,但是Comex的黃金庫存只是增加一點點,而白銀庫忖則更加減少(截至15/4/2013)
剛才我打電話去Nubex,問他為何在金銀大跌的這幾天,為何他們的金銀存貨會減少如此多?
對方回答因為出現更多的買潮,甚至連Pre-order也沒有貨了!
在2011年金價從1910暴跌時,GoldSilver.com的麥克馬尼龍和幾家美國主要的貴金屬交易商,出現3個月拿不到黃金新貨的情況,白銀只有一款可以拿到而已。
明白嗎?為何我們要實物!
下文是金甲 Jo 兄 文章 轉載!
實物與期貨較量──金市大戰
金價繼續大跌,發生甚麼事?似乎有人心急如熱鍋上螞蟻,要盡快把金價打下去,嚇退持有實物者,令他們盡快沽貨!看看近期Comex的實金儲備,嚇死人!儲 備急速減少,其中又以超級大戶JP Morgan的持貨量,由1月至今,大幅減少!即是說有人正向JP Morgan發動提貨戰!
甚麼人呢?其中馬田大師在網誌中提到,歐洲有人從Comex倉庫提金: http://armstrongeconomics.com/2013/04/14/gold-inventories-shifting-to-europe/
另外,早幾日,Kingworldnews提到來自上海的提貨者單單於3月就提走了283噸: http://kingworldnews.com/kingworldnews/KWN_DailyWeb/Entries/2013/4/12_Maguire_-_Over_500_Tons_Of_Paper_Gold_Sold_In_Takedown.html
Maguire:Deliveries in Shanghai alone in March were 283 tons. In the eight trading days of April, we have seen another 117 tons (of gold) delivered. Today was another 20 tons delivered. So what we are looking at here is over 400 tons (of gold) in less than a month and a half.
另外市場貨源短缺,有人被夾得很慘:
http://kingworldnews.com/kingworldnews/KWN_DailyWeb/Entries/2013/4/13_Haynes_-_Were_On_The_Verge_Of_Major_Gold_%26_Silver_Shortages.html
歐洲可能將有大事發生!如此提貨,如果提貨者繼續,或大眾持續買入實金,有一個可能出現,黃金期貨市場關門!持有所有Paper黃金者,包括期金,倫敦 金,紙黃金要小心!大戰將會繼續,請坐穩!如有實貨市場動向,歡迎報告!小弟這幾日會入貨!希望趕得及買!(今天仍分身不下)
結語:
我推測,這也許是華爾街 vs 市場經濟,或者紙金銀 vs 實物金銀 的最後一場大戰了!
如果華爾街和紙金銀戰勝,金銀價格可能又會被壓制幾年。但是,我還是選擇市場經濟和實物金銀會取得最後勝利。
因為我從來沒有聽過紙幣可以戰勝金銀的案例。
就像你下個賭注,假如世界末日,你認為人類存貨的機率高,還是蟑螂存活的機率高?
讓我們看下去,如果實物庫存還是繼續留出,華爾街就大條了!
附上:金銀生產成本資料
很多人根本搞不清楚金銀的生產成本,因為金銀礦公司從不提供數據,只能有各種機構自行調查。
通常,我們在年報中看到的是不全面的現金成本(Cash Costs)。
下圖是全球最大的金礦公司Barrick的cash costs,請注意,是否出高速成本增長?這漲幅是否提供了黃金價格上漲合理的依據?

在看全球經營效率最好的銀礦公司Pan American Silver的Cash Costs。

請記得,這些都不是完全的成本,
看回這成本,你相信黃金白銀真是泡沫嗎?
金價下跌 大陸客湧進香港買金 金鋪門庭若市
鉅亨網新聞中心 2013-04-16 13:44:42金價下跌刺激金飾銷售,旺角幾乎所有金鋪的黃金櫃檯都被顧客逼爆,店員應接不暇,與周圍其他商品專櫃的門庭冷落形成鮮明對比。有顧客甚至花半天時間精心挑選各款黃金飾品,更有許多顧客在旺角多家不同品牌的金鋪出出入入。店員向記者透露,3天前入鋪光顧的購金客就明顯增多。
《星島日報》報導,現場所見,詢問和購買黃金首飾的以大陸客居多,許多大陸遊客表示被金價下跌吸引,紛紛攜親友赴港買金,一是為自用,二是為保值,多數人對黃金未來的升值潛力仍非常有信心。
錢先生自稱來自北京,本來只是來香港出差,恰逢金價下跌這個好時機,就買個金手鐲給女友,相信黃金日後會增值。來自深圳的閻小姐表示,自己本來就有 經常來港購金的習慣,但近來金價跌了很多,便趁此機會買多些;又表示完全不擔心金價會繼續下跌。她同丈夫和母親來港不過一日,已購買3萬多元的金飾。
周大福發言人指出,集團目前仍然是以賣出黃金為主,金價大跌之後,雖然擔心金價續跌而沽出黃金的人數有所增加,但增加更多的是前來買金客人,其中有自用也有投資。
另外,金價暴跌令K金回收也受影響,香港珠寶玉石廠商會理事陳日強估計,金價下跌令回收金生意減少約1成。K金回收站負責人陳先生估計,近兩日整體 回收生意額跌約3成,查詢電話亦由高峰期的近百個跌至近日的10多個,當中以足金金器跌勢最明顯,因不少客人以為K金價值低,願意以低價割愛,反而變賣足 金金器的態度較審慎,他又預期未來金價仍有機會下調1成。
最新消息:芝加哥商業交易所(CME)表示,將在周二收盤提高黃金、白銀與其它貴金屬期貨保證金要求。
Comex 100金衡盎司黄金期货的保证金将被提高19%,白银期货保证金将提高18%,钯保证金提高14%,铂提高19%,天然气期货保证金将提高5.6%。
在金銀價格暴跌時還上調保证金?
正常情況應該是下跌時降低保證金,哪有上調的?
分明就是要趁機打落金銀價格水狗。
自荷蘭銀行無法提交金銀實物後,全球交易所和銀行出現大幅度的黃金白銀提取,華爾街就即刻對金銀漲開攻擊。
看到底使紙金銀利害,還是最後實物金銀才會成為最後的勝利者。
ALL US WHOLESALERS SOLD OUT OF ALL PHYSICAL SILVER!!!
April 15, 2013 By The Doc 78 Comments
Tweet
*UPDATE: ALL US WHOLESALE SUPPLIERS ARE NOW SOLD OUT OF EVERY OUNCE OF PHYSICAL SILVER & HAVE SUSPENDED ALL SALES!
SDBullion.com has closed due to lack of ANY AVAILABLE SILVER!
Two of the largest wholesale suppliers in the US, including Amark and CNT, who is the supplier of gold blanks to the US Mint for Gold Eagles, and is a registered COMEX depository, HAVE JUST SOLD OUT OF ALL PHYSICAL SILVER!!!
AND……IT’S GONE!!!!!
In the face of an EPIC TSUNAMI of gold and silver sales today as the cartel hammered the price of silver down over 12%, and off $6 from Friday’s open, we have just been informed at SDBullion upon trying to place a large inventory order that BOTH AMARK & CNT ARE SOLD OUT OF EVERY LAST OUNCE OF PHYSICAL SILVER!!!
Apparently the fact that one of the largest wholesale suppliers in the US is SOLD OUT, while simultaneously the 2nd largest silver mine in the US is offline perhaps permanently is of absolutely no consequence to the paper dumping cartel bullion banks.
Bullion bank silver shorts are most likely covering in mass RIGHT NOW, and we’ll soon have the data to make the case. Many have speculated that the bullion banks are going to switch to a net long position. There couldn’t be a better time to do just that given that at $22/oz, pretty much all existing shorts taken out before this week will be in the money.
2013年3月16日星期六
Discovery - 銀礦的開採
彼得林區說過這麼一段話:「要區分投資和賭博並不是看您從事何項活動(例如:創業、買股票、賭馬),而是要看您對這項活動所牽涉的技巧、了解的程度以及參與的企圖心。賭馬老手堅持自己的一套下注原則,靠賭馬取得一份相當穩定的長期報酬,對他來說這就像投資績優股一樣可靠。而有些魯莽衝動的投資人成天追逐熱門股、聽信名牌、殺進殺出,這種『投資』方式跟在跑馬場上隨便挑隻鬃毛最漂亮的馬就胡亂下注沒什麼兩樣」。
對自己所參與的活動一定要有深入的了解,才是不至於踏上賭博一途的最佳方式。
對自己所參與的活動一定要有深入的了解,才是不至於踏上賭博一途的最佳方式。
2013年3月11日星期一
BREAK EVEN COST FOR SILVER RISES TOWARDS $30 AS COEUR, HECLA & SILVER STANDARD SHOW NET INCOME LOSSES
隨著成本上漲,銀礦商表示,白銀價格須在 30美元,
才能維持收支平衡

By SRSrocco:
Well, the third quarter results are now out, and it looks like several of the primary silver miners stated a net income loss for the period.
The three primary silver miners produced 8.1 million ounces of silver during the third quarter of 2012 and all showed a net income loss. Here we can see that for several of the primary silver miners, the break even cost now for producing silver is now $30 an ounce.
As costs rise, so will the break even price of silver.
Coeur produced the most of the three at 4.4 million ounces in Q3 2012. Even though Coeur said they had a $9.83 cash cost per ounce, it had a net income loss of $15.8 million for the period:

Coeur received $30.09 an ounce for their silver Q3 2012 and had a total of $230 million in revenues. However, it looks as if break even price of silver for Coeur is now at least $31-32 an ounce.
Silver Standard was another primary silver miner that stated a net income loss for the third quarter in 2012. Silver Standard produced 2.1 million ounces of silver and had total revenues of $73.5 million in Q3 2012 with a $2.5 million net income loss:

What is noteworthy about Silver Standard’s financials, is that they actually sold 600,000 more ounces of silver in the period (2.7 million oz) than they produced and still came up with a net income loss.
Silver Standard does show in their report that their total production cost of silver coming from their Pirquitas mine is $29.20 an ounce. They received an average $29.37 an ounce for their silver that they sold during the period. If we figure that they sold 28% more silver than they produced in the third quarter and still ended up with a net income loss… I would believe Silver Standard would require at least $32-33 to break even.
Hecla as another primary silver miner to show a net income loss for the same period. While it is true that Hecla lost production and revenue due to the temporary closing of their Lucky Friday Mine (until Q1 2013), we can make a case that Hecla also needs close to $30 to break even.

Hecla stated a net income loss of $885,000 on $81.8 million in total revenues. This revenue came solely from their Greens Creek mine. Hecla produced 1.6 million ounces of silver in Q3 2012 at a cash cost of $3.52 an ounce. With that sort of cash cost, you would think Hecla would be a so-called LOW COST SILVER PRODUCER. They are… on paper.
Even though Hecla sold 300,000 ounces of silver less than it produced in the quarter, it also did the same thing during the same period in 2011. What is interesting is that Hecla actually received $35 an ounce for their silver in Q3 2012. If we were to add another 300,000 ounces of silver sales to their total revenue, but dropped the priced received to only $30 an ounce, I would imagine that Hecla would also be close to break even.
The three primary silver miners produced 8.1 million ounces of silver during the third quarter of 2012 and all showed a net income loss. Here we can see that for several of the primary silver miners, the break even cost now for producing silver is now $30 an ounce.
Of course all the silver miners did not show a net income loss for the period. However, Pan American Silver’s net earnings fell from $52.5 million Q3 2011, to only $22.6 million in the present quarter. This is a 57% decline in net earnings compared to the previous year. That would be bad enough… however Pan America’s revenues were $252 million this quarter compared to $221 million in the same period in 2011.
Here’s the real clincher. In Q3 2012, Pan American Silver produced 6.3 million ounces of silver by processing 2.5 million tonnes of ore compared to 5.5 million oz of silver from 1.1 million tonnes of ore the same period in 2011. Thus, Pan American Silver’s cost of production increased a staggering $49 million (55%) to $138 million from $89 million from the same period last year.
As costs rise, so will the break even price of silver.
Original Source
2012年9月5日星期三
GLOBAL COPPER INVENTORIES TO DECLINE SUBSTANTIALLY THIS YEAR- How Much Will it Affect Silver Production?
今年銅庫存減少..,繼而影響白銀產量
Submitted by SD Contributor SRSrocco:
Costs are increasing faster than the price of commodities are rising. Even though some copper miners are making decent profits, it is not enough to supply all the FUTURE CAPEX spending that these companies have in their pipelines. We must remember, the so-called forecasted increase of global silver production is based on these scheduled base metal mines becoming commercial.
Author: Dorothy Kosich
Posted: Friday , 31 Aug 2012
RENO (MINEWEB) -
Folks… just look at amount of production losses at the big copper mines. This is nearly 300,000 metric tonnes. Freeport’s Grasberg mine was down 45% the first six months of 2012 compared to last year. The largest percentage of the copper declines came from Chile. As I mentioned in my previous article…. Chile is going to face serious energy shortages unless there is Billions of dollars invested in electric generating plants and infrastructure.
If overall copper production declines in 2012, it will also impact silver production as well. We may see another percent decline in by-product silver from copper mining in 2012.
Here is another part of the article:
Costs are increasing faster than the price of commodities are rising. Even though some copper miners are making decent profits, it is not enough to supply all the FUTURE CAPEX spending that these companies have in their pipelines. We must remember, the so-called forecasted increase of global silver production is based on these scheduled base metal mines becoming commercial.
UPCOMING POST ON SILVER ORE GRADES
I had a spirited debate on silver ore grades recently with several bloggers. They both mentioned that silver miners were utilizing lower grade ores and waste rock to maximize profits as the price of silver increased. This is an excellent way for miners to increase profits and to mill ore that wasn’t cost effective with the price of silver lower.
I have to say…. anything that makes silver miners more profitable and successful is good in my book. That being said, it still does not change the overall fact that silver ore grades are falling greater than 5% a year on average.
This chart of the silver ore grades at SilverCorp will be included in my next article-post to describe this ongoing phenomenon:

If we consider that SilverCorps overall ore grade was 456 g/t in 2007 and is estimated (by their quarterly report) to average 245 g/t in Fiscal 2013, this turns out to be a 8% annual decline rate for the 6 years.
I will provide additional data to prove that Silvercorp has a LOM PRODUCTION PLAN until 2019 showing a continually declining average ore grade. This is not because they are mining waste rock or selecting lower grade ores… its because of its planned declining ore reserve.
Again… we must remember the KISS — KEEP IT SIMPLE STUPID understanding of my concerns. The lower the ore grade… the more energy is needed to produce the same or less silver.
Orginial Source
Submitted by SD Contributor SRSrocco:
Costs are increasing faster than the price of commodities are rising. Even though some copper miners are making decent profits, it is not enough to supply all the FUTURE CAPEX spending that these companies have in their pipelines. We must remember, the so-called forecasted increase of global silver production is based on these scheduled base metal mines becoming commercial.
Author: Dorothy Kosich
Posted: Friday , 31 Aug 2012
RENO (MINEWEB) -
Substantial production losses and outages at existing copper mines will cause global copper inventories this year to fall to 47 days of consumption from 52 last year, Scotiabank economist Patricia Mohr has forecast.——————————–
While refined copper stocks average 61.1 days of consumption from 2000-2009, “LME inventories have actually declined in 2012 and overall global inventories are expected to fall to 47 days of consumption from 52 last year, despite the recent increase in bonded warehouse stocks in China,” said Mohr. “This reflects substantial production losses & outages at existing mines this year-Escondida (Chile -75,000 tonnes), Collahuasi (Chile), Los Bronces (Chile -60,000 tonnes), Grasberg (Indonesia -100,000 tonnes) and Lumwana (Zambia -60,000 tonnes).”
Folks… just look at amount of production losses at the big copper mines. This is nearly 300,000 metric tonnes. Freeport’s Grasberg mine was down 45% the first six months of 2012 compared to last year. The largest percentage of the copper declines came from Chile. As I mentioned in my previous article…. Chile is going to face serious energy shortages unless there is Billions of dollars invested in electric generating plants and infrastructure.
If overall copper production declines in 2012, it will also impact silver production as well. We may see another percent decline in by-product silver from copper mining in 2012.
Here is another part of the article:
“Major Canadian gold miners are also examining project expansion more critically, in part due to high capital cost inflation,” she added.———————–
Recent announcements by BHP Billiton of project delays, “reflect concern over capital-cost escalation in the face of more subdued metals prices,” Mohr advised. “In copper, capital cost inflation (which normally lags metals prices) has averaged 22% per annum from 2002-2011 and is projected to increase by 15-20% this year.”
Costs are increasing faster than the price of commodities are rising. Even though some copper miners are making decent profits, it is not enough to supply all the FUTURE CAPEX spending that these companies have in their pipelines. We must remember, the so-called forecasted increase of global silver production is based on these scheduled base metal mines becoming commercial.
UPCOMING POST ON SILVER ORE GRADES
I had a spirited debate on silver ore grades recently with several bloggers. They both mentioned that silver miners were utilizing lower grade ores and waste rock to maximize profits as the price of silver increased. This is an excellent way for miners to increase profits and to mill ore that wasn’t cost effective with the price of silver lower.
I have to say…. anything that makes silver miners more profitable and successful is good in my book. That being said, it still does not change the overall fact that silver ore grades are falling greater than 5% a year on average.
This chart of the silver ore grades at SilverCorp will be included in my next article-post to describe this ongoing phenomenon:

If we consider that SilverCorps overall ore grade was 456 g/t in 2007 and is estimated (by their quarterly report) to average 245 g/t in Fiscal 2013, this turns out to be a 8% annual decline rate for the 6 years.
I will provide additional data to prove that Silvercorp has a LOM PRODUCTION PLAN until 2019 showing a continually declining average ore grade. This is not because they are mining waste rock or selecting lower grade ores… its because of its planned declining ore reserve.
Again… we must remember the KISS — KEEP IT SIMPLE STUPID understanding of my concerns. The lower the ore grade… the more energy is needed to produce the same or less silver.
Orginial Source
2012年7月18日星期三
未來白銀價格將走向何方
http://ag.cngold.org
白銀走出貨幣舞台已經是一個多世紀之前的事情了。不過從其需求關係來看,由於需求方需求量的增加,白銀長期的價格走勢應當以逐步上升為主。特別是在未來5~10年裡全球半導體市場將會發生最為深刻的變化,電子產品的更新換代以及消費需求的慢慢回暖,將會是推動白銀需求增長的重要因素。
近兩年支撐白銀需求的最主要部分——工業需求的變化並不大,儘管經濟危機讓很多行業的需求都下降了。
究其原因,是半導體行業受到智能手機和平板電腦等新型電子產品的普及促進了白銀工業需求的增長。根據北美半導體協會的最新統計數據顯示, 2011年全球半導體銷售額成長率為0.4%,總金額達2995.2億美元。半導體行業的數據表明,儘管遭遇了金融危機和日本大地震,但是全球半導體消費增長的勢頭並未減少,這也意味著工業對白銀的需求也並未減少。可以預見,一旦經濟恢復,工業再次快速發展起來之後,白銀的需求也將隨之增加。
此外,還有一個有趣的現象,由於能源成本和人力資源成本的上升,白銀的礦產成本在過去幾年裡也大幅上升。 2007年時白銀的礦產成本僅有1.36美元/盎司,但是到了2011年,白銀的礦產成本已經上升到了7.25美元/盎司,如果按照市場均價是礦產成本的3~5倍來計算的話,那麼白銀的合理價格應當在年平均22美元/盎司~36美元/盎司之間。因此,未來白銀的價格很可能會出現成本推動型的上升。
長期來看,白銀價格重新回到40美元/盎司之上甚至於超過50美元/盎司的水平都是有可能的。不過,這一切都要看全球經濟的恢復水平,畢竟,金融危機仍未過去,工業生產和消費的增長也並未完全恢復,這個過程可能還需要很長時間。
2012年6月28日星期四
2011 COMPLETE COST FOR MINING SILVER
 | |
| 2010 Year |
Last year, I wrote an article titled THE COMPLETE COST OF MINING SILVER. In it I used a quick formula to figure what a more true cost would be for an ounce of silver than the CASH COST.
This is an update of the complete cost for mining silver in 2011.
Miners use the CASH COST to compare just how cheap it is to mine silver.
They arrive at their CASH COST by adding all the by-product
revenue against an ounce of silver. For example, if a miner has some
Gold, Lead and Zinc in a ton of ore, they take the revenue received
from those by-product credits and get an INSANELY LOW CASH COST. In
2011, HECLA had a CASH COST of only $1.15 an ounce for silver. To the
layman they would think that they would have all this wonderful profit
– but they don’t.Hecla actually had TOTAL REVENUE of $477.6 million with a NET INCOME of only $151.1 million. You would think with such a low CASH COST that they would be making nearly $350-$400 million. That is why I came up with my COMPLETE COST for getting a truer figure.
Before I put out the CHARTS… let me give you my DISCLAIMER. After I came out with the article last year, I had several emails telling me why my formula was incorrect. While it is true, that my COMPLETE COST is not the best way to get a accurate estimation, it is the simplest way. I like KEEP IT SIMPLE STUPID — KISS.
First, this is last year’s formula for getting the Complete cost from HECLA’s 10-K:

And this was last year’s COMPLETE COST CHART for (4) primary silver miners:

I did the calculations for 2011, and this is what I found to be the COMPLETE COST PER OUNCE for mining silver at this time:

The RED LINE is the CASH COSTS put out by the Mining companies. The BLUE LINE is my COMPLETE COST that I arrive by dividing the NET INCOME by the TOTAL REVENUE… this gives me a percentage of PROFITS. I then take that percentage and times it by the average price of silver in 2011 which was $35.12 oz. That figure is the PROFIT PER OUNCE for each mining company.
First hand, we can see that actual CASH COSTS for two of the mining companies in the United States (US SILVER-REVETT MINERALS) is actually very high at $17.50+. I will take US SILVER for an example:
US SILVER CORP:
Total Revenue = $93.4 million
Net Income = $21.3 million
$21.3 mil / $93.4 mil = 22.8%
$35.12 X 22.8% = $8.00 PROFIT PER OUNCE
$35.12 – $8.00 = $27.12 COMPLETE COST PER OUNCE
————————————————————————————–
Now if the AVERAGE PRICE of SILVER had fallen below $27.12, US SILVER CORP would have started to get into what I call the BREAK-EVEN area. I would imagine if we had $20 an ounce silver in 2011, US SILVER CORP would have had a NET INCOME LOSS.
Again, this is a BALL PARK WAY of getting to a TRUER figure. As for by-product metals… we must remember, all mining companies are selling their by-product metals at market value. Some have used hedges, or have a certain contracted rate (such as Silver Wheaton)… but they all do this.
If the price of Silver falls, so does the price for Lead, Zinc, Copper and Gold. My method just makes calculating this figure simply. I could spend hours comparing what the mining company PRODUCED and what it actually SOLD in metal ounces. They always sell less than they mine, so to me it all evens out in the wash.
If the AVERAGE PRICE of SILVER keeps falling in 2012, but the COSTS for mining increase (which they have), these miners will make a lot less NET INCOME this year.
-SRSrocco
http://www.silverdoctors.com/
訂閱:
文章 (Atom)