
2025年3月31日星期一
2025年3月9日星期日
2024年12月28日星期六
China Secretly Snaps Up More Gold, Positions for Its Greater Global Role
While 99% of the media keeps staring at official data by the Chinese central bank (PBoC)—misleadingly stating it added 5 tonnes of gold in November following a supposed six-month pause—the PBoC’s "unreported" purchases in London accounted for a stunning 60 tonnes in September and another 55 tonnes in October.
And while cross-border trade statistics from the U.K. for November have yet to be released, I foresee another purchase of a similar magnitude.
Chinese authorities see a greater role for gold in the future international monetary system, or they wouldn’t continue buying such extraordinary amounts of gold. Via London alone, the PBoC has stockpiled 1,000 tonnes of gold since Russia’s foreign exchange assets were “frozen” by the West early 2022.
London Exports to China Are a Proxy for PBoC Buying
Since July this year, I have been writing that a large share of China’s gold imports into the domestic market is not bought by the private sector. We can conclude that the bars exported from the U.K. to China are secretly destined for the PBoC.
Initially, I based my analysis on a pronounced surplus in the Chinese domestic gold market—resulting from supply (mine, recycled gold, and imports) outstripping demand. The most conceivable explanation for this surplus is that the central bank of China is behind large gold imports.
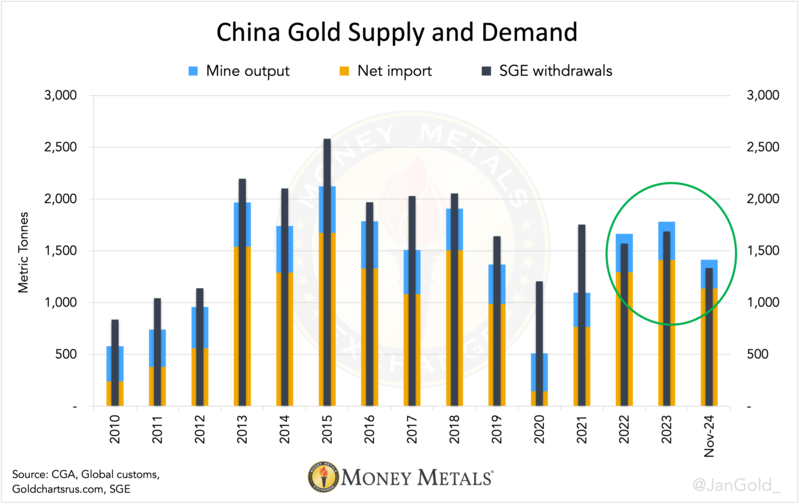
Chart 1. From 2022 until November 2024 there is a surplus in the Chinese gold market, because import and domestically mined gold was more than SGE withdrawals.
My findings became more evident when in September the premium on the Shanghai Gold Exchange (SGE) turned negative, but Chinese gross imports accounted for a sturdy 95 tonnes for the month.
It makes no economic sense for any bullion bank to buy gold abroad and sell at a loss at the SGE. The 60 tonnes (in 400-ounce bars) exported in September from the London Bullion Market to China went to the vaults of the PBoC in Beijing, I therefore concluded.
The PBoC Keeps Up the Pace, Buying 55 Tonnes in October
I noted the following in my last article:
…we can see that in October, the SGE was trading at a discount while imports reached 95 tonnes, which was the same as in the prior month. I strongly suspect the PBoC was secretly buying gold in London again.
Recent data by Her Majesty’s Revenue & Customs (HMRC)—Britain’s tax, payments and customs authority—reveal 55 tonnes were indeed dispatched from the London region to China in October.
Meanwhile, it’s likely the PBoC also bought gold elsewhere. Total imports into the Beijing region accounted for 69 tonnes in October, as per General Administration of Customs People's Republic of China. That’s 14 tonnes more than what was shipped from London.
An illustration I shared previously is a chart of the PBoC’s publicly disclosed gold purchases versus U.K. gold exports to China. The chart shows both are loosely correlated "although the PBoC usually takes up to a year to publicly report its acquisitions and keeps about 65% of it hidden" (quote from my article from November 26, 2024).
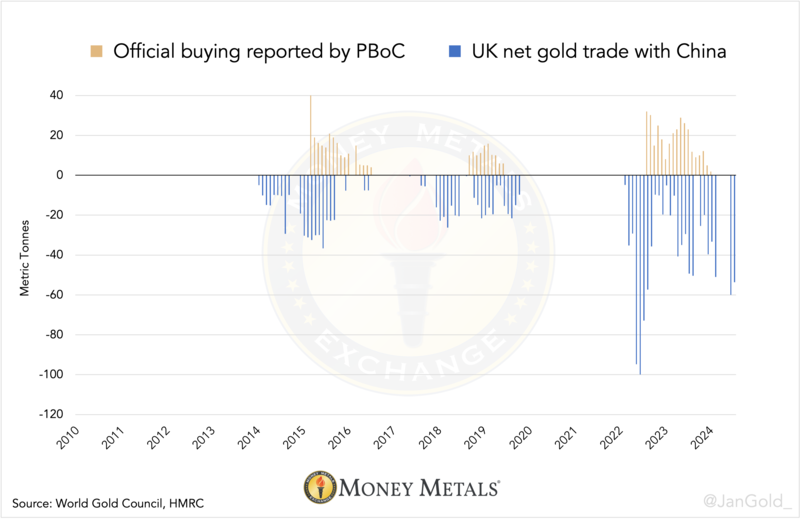
Chart 3. The PBoC’s publicly disclosed gold purchases versus U.K. gold exports to China that serve as a proxy for covert buying by the Chinese central bank.
Only two months after September (when the PBoC covertly resumed buying in London), it revealed to the world it bought a mere 5 tonnes in November. Even this fraction of the truth boosted sentiment in the gold market. Go figure.
The Chinese central bank is currently buying at least ten times more gold than what you read in the newspaper, and yet markets got excited based on mere breadcrumbs!
Goldman Sachs Writes on PBoC Gold Buying in London
Meanwhile, my research is gaining traction as it was picked up by Goldman Sachs (GS). Below you can see a chart by GS displaying what I first demonstrated in July, but with a different design.
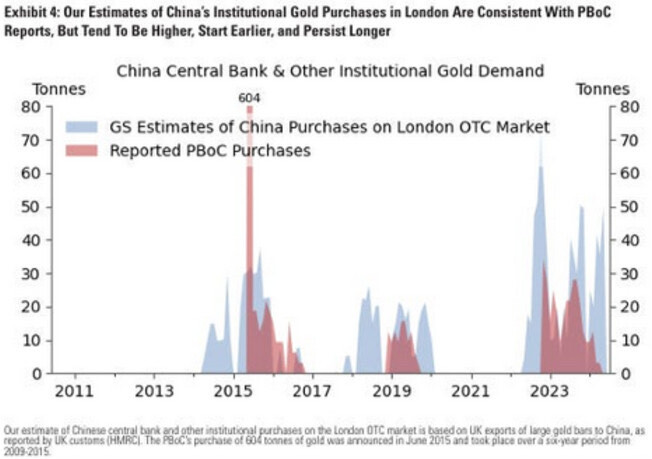
Chart 4. Courtesy of Goldman Sachs.
At the bottom it reads "our estimate of Chinese central bank … purchases on the London OTC market is based on UK exports of large bars to China, as reported by UK customs (HMRC)." (Parroting my own conclusion.) Eventually other media will start writing about these huge purchases as well.
For me, this topic reminds me of my early work analyzing SGE withdrawals. In 2013, I began spotlighting the volumes of gold withdrawn from SGE vaults, documenting why that is a proxy for Chinese wholesale demand. By implication, gold demand in China at the time was twice what consultancy firms stated. A few years later, nobody argued about the meaning of SGE withdrawals anymore.
Gold’s Role in the International Monetary System Will Increase
In November, gold on the SGE was still trading at a discount, yet Chinese gross gold imports swelled to 122 tonnes. No doubt the PBoC struck big in the London Bullion Market once again.
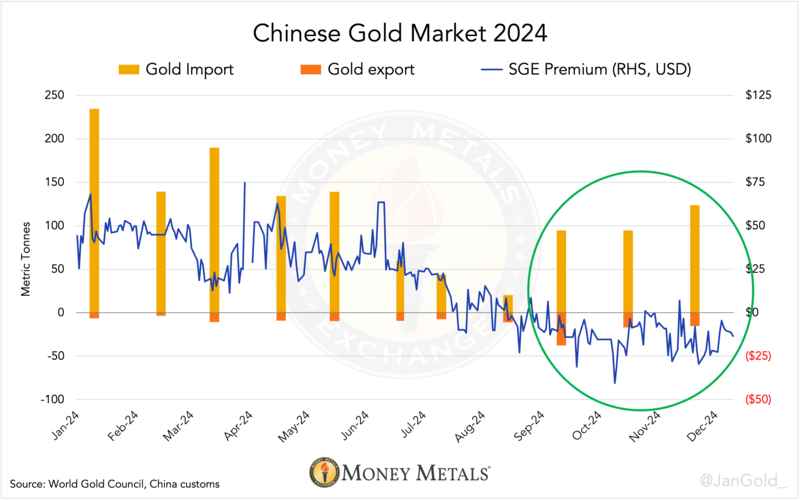
Chart 5. The Chinese central bank orders gold abroad at bullion banks and outsources transport to Beijing to those banks, making them have to register the metal at customs.
My latest estimate of the PBoC’s true gold holdings is roughly 5,000 tonnes, a number that is in stark contrast to what the Chinese divulge to the IMF, i.e. 2,271 tonnes. (I will substantiate my estimate in a follow up article.)
Tellingly, it seems some large investors in the West are sniffing out the momentous developments in the gold market. Although the U.K. was a gross exporter of 55 tonnes to China in October, the U.K. itself net imported 110 tonnes.
Who bought? Most likely institutional money as ETF holdings stored in London increased by only 18 tonnes, according to statistics compiled by friend and data wrangler Nick Laird from GoldChartsRUs.com.
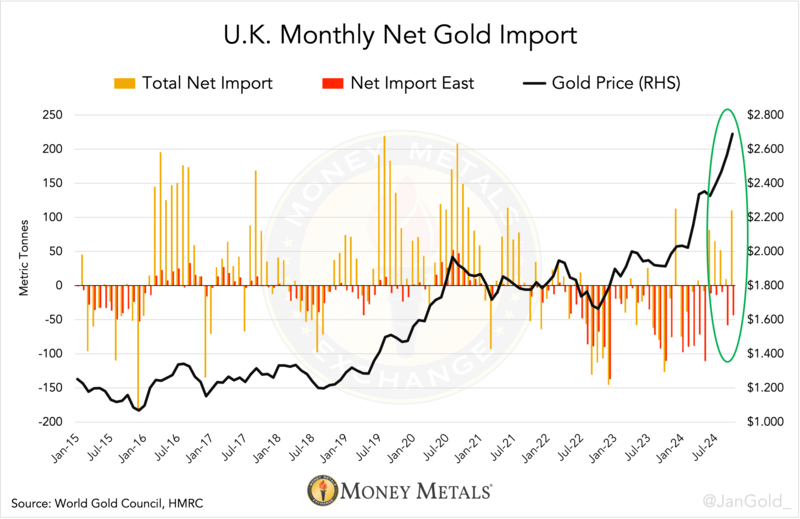
Chart 6. Western institutional money must be buying gold too, because London inflows are substantial. As an aside, HMRC’s numbers show mostly mining countries exported to the U.K. (Australia, Canada, Kazakhstan, South Africa, United States, Uzbekistan), next to Germany, Singapore, and Switzerland.
These are exciting times indeed for gold.
China’s monetary authority doesn’t buy gold for no reason at a pace of approximately 60 tonnes a month from Great Britain alone—now 1,000 tonnes in total since the war in Ukraine. The Chinese obviously see a greater role for gold in the international monetary system going forward.
Over the same 30-month period, the value of China’s holdings of U.S. Treasuries has declined by $250 billion.
What we’re witnessing a shift from "dollar recycling"—the status quo from 1971 through 2021—to "gold recycling." Instead of investing trade surpluses in dollars, countries are increasingly choosing for gold.
The Saudi central bank is also buying gold under the radar, next to many central banks buying openly.
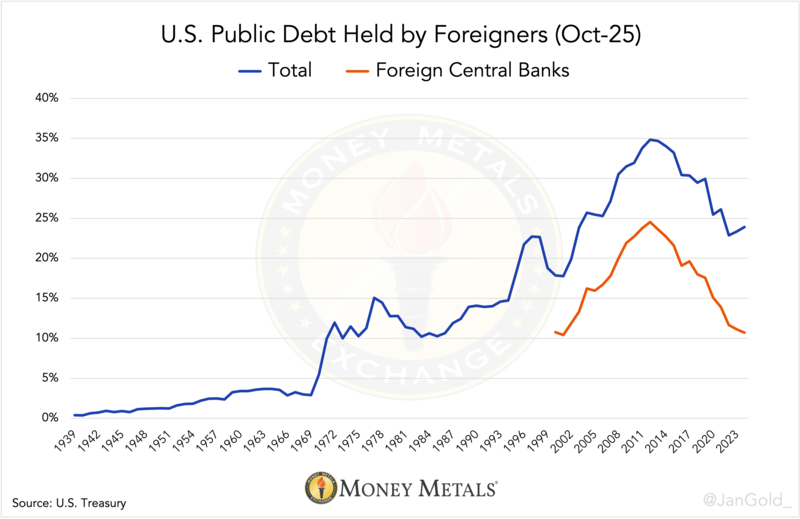
As a result, less and less of the U.S. its excessive public debt (122% of GDP) is financed by foreigners, let alone foreign central banks. This forces Treasury to either reduce the fiscal deficit (currently 6% of GDP, good luck!), pay higher interest rates and accelerate the debt spiral, or print its way out of this through inflation.
In addition to dollar weaponization, the (global) debt overhang is a motive for central banks to increase their gold reserves, as historically inflation is the most common big way of restructuring debts.
2024年11月8日星期五
2024年10月27日星期日
隨著西方投資者突然轉向黃金,重大轉變被揭示出來
在過去的兩年裡,東方對黃金價格的重大上漲負有責任,使其與西方的定價模式脫模。 但西方投資者收回了接力棒,自2024年6月以來一直在推動黃金走高。
令人憚動的是,西方投資者也在放棄他們舊的定價模式。 他們現在不是出於投機原因參與黃金市場,而是將黃金作為避風港購買。 這是非常看漲的,因為華爾街幾乎沒有黃金的曝光率。
與此同時,以淨值計算,東方沒有賣出。 在這個緊張的市場中,金價正在急劇上漲:今年至今,黃金價格已經上漲了30%以上。
黃金價格是由邊緣買家驅動的
黃金價格的設定通常由全球黃金從西向東流動決定,反之亦然。 出於幾個原因,瞭解誰是邊緣買家(定價者)實際上很重要。
識別邊緣買家為金價上漲或下跌的原因提供了背景資訊。 從歷史上看(在過去的100年裡),西方的機構供求關係定了價格,而東方透過在牛市買入或在熊市買入來降低波動性。
正如東方最近所表明的那樣,它也可以成為黃金市場的驅動力,這樣做的原因還沒有消失1。 如果我們同時看到兩個半球的持續買入,這將在黃金中產生一場完美的風暴。
東方的覺醒
在2022年底至2024年5月黃金的上漲期間,市場觀察家們很清楚,這不是由交易所交易基金(ETF)購買驅動的,因為ETF持有量在此期間有所下降。
這也不是由倫敦或瑞士的場外交易購買引起的,因為這兩個交易中心都是淨出口商。 在2022年之前,ETF庫存將膨脹,當金價上漲時,英國和瑞士將淨進口。
隨著黃金與2022年10年期國債通脹保護證券(TIPS)收益率脫鉤,一些新的事情正在發生。 雖然從長遠來看這沒有什麼意義2,但從2006年到2022年初,西方交易員更喜歡TIPS收益率來定價黃金。
在很大程度上,由於地緣政治緊張局勢和金融條件的惡化,中國和沙特央行——以及在較小程度上,中國、泰國和土耳其等私營部門——正在推動黃金上漲。
從2022年初到2024年第二季度,央行總共購買了2500噸,根據我的研究,其中中國人民銀行購買了1600噸,其沙特同行購買了160噸(如此處和此處所述)。
在此期間,東方負責黃金市場。
西方投資者又回來購買黃金了
自去年6月以來,黃金價格一直在上漲,黃金ETF庫存上漲,倫敦金條市場的所在地英國已經變成了淨進口國。
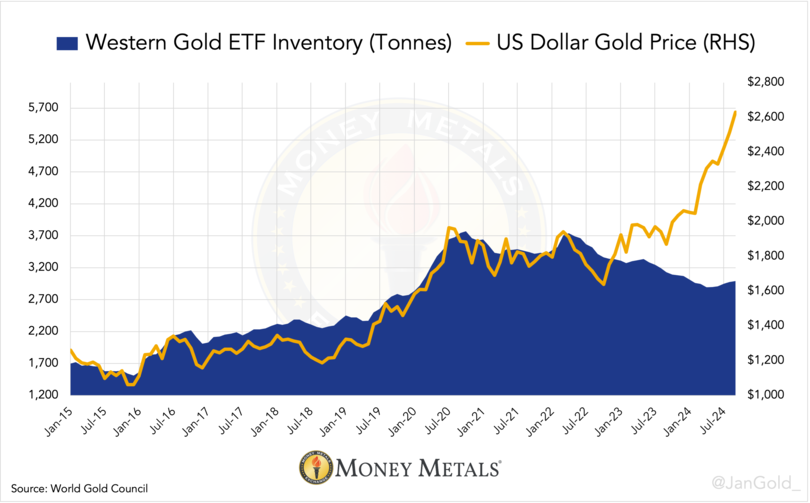
圖表1。 每月持有的西方黃金ETF。 世界其他地區的ETF持有量僅佔黃金ETF總量的6%。
此外,黃金價格再次與TIPS收益率相關四個多月。 但從本月開始,這種相關性正在崩潰,而西方繼續成為價格上漲的驅動力。
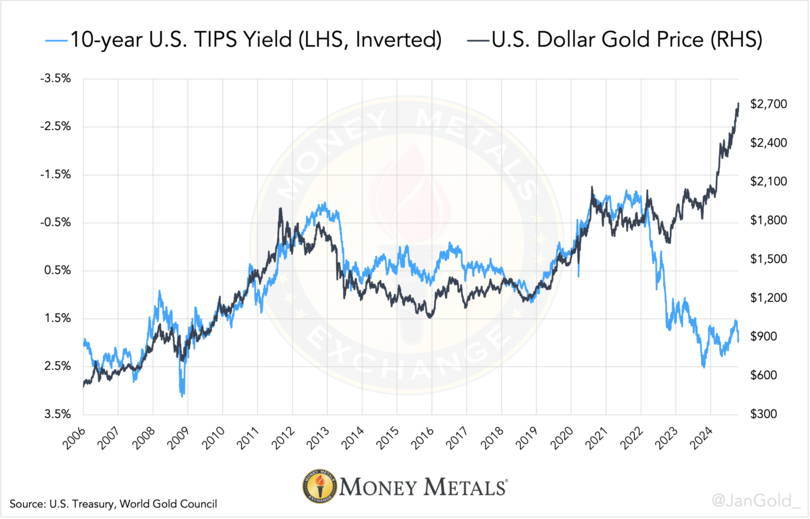
圖表2。 截至2024年10月18日,TIPS收益率與黃金價格相比。
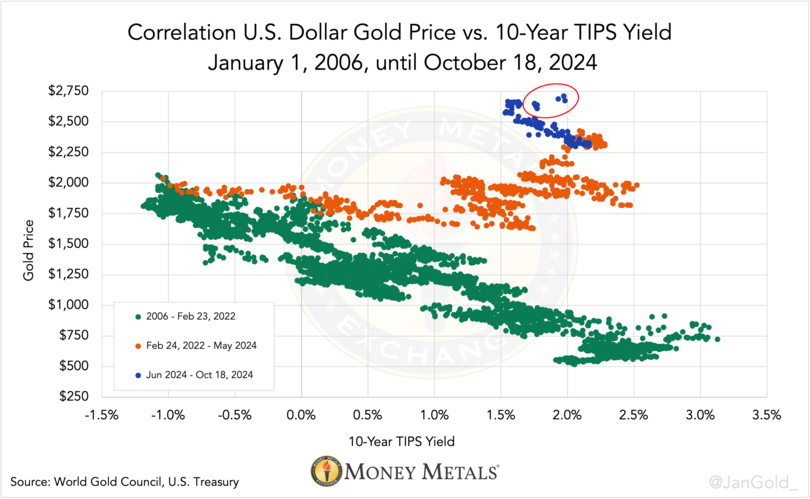
圖表3。 自6月以來,藍點一直在形成一個新的對角雲,重申了舊的TIPS模型以更高的價格,儘管在10月,該模型被中止了(紅色橢圓形)。
與此同時,東方的黃金需求已經放緩。 上海黃金交易所的溢價從7月開始呈負值(並且仍然是),中國進口最近幾個月有所下降,印度也是如此。
全球指標表明西方重新掌管市場。
緊張的黃金市場
黃金市場還沒有完全恢復到2022年之前的樣子。 東方對世界上最大的煉油中心瑞士的恥辱(正如我們在2022年之前在金價上漲時看到的那樣)此後再也沒有發生過。 我的看法是,在最近的一次上升中,東方正在喘口氣,但它還沒有買完。
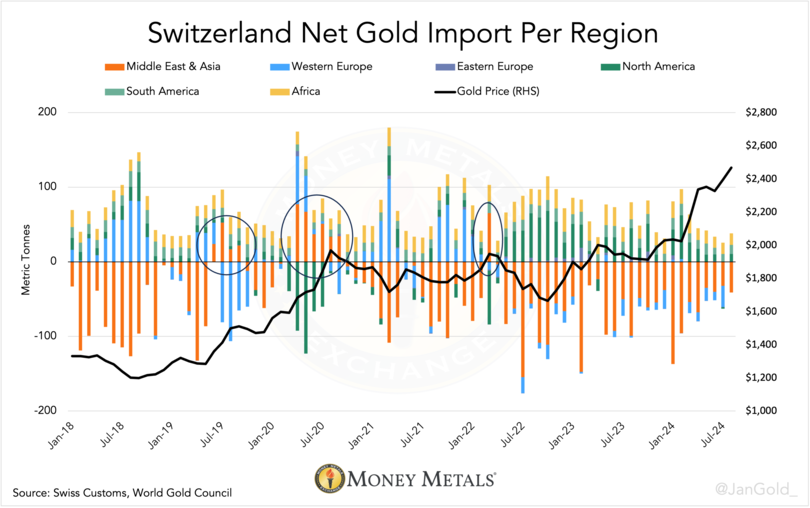
圖表4。 淨金流經瑞士的地區。 自2022年第二季度以來,儘管價格上漲,但東部對瑞士的淨值並沒有不光彩。
雖然從6月到8月,英國一直是黃金的淨進口國,導致黃金價格上漲,但在這段時間裡,英國向中東和亞洲國家淨流出。
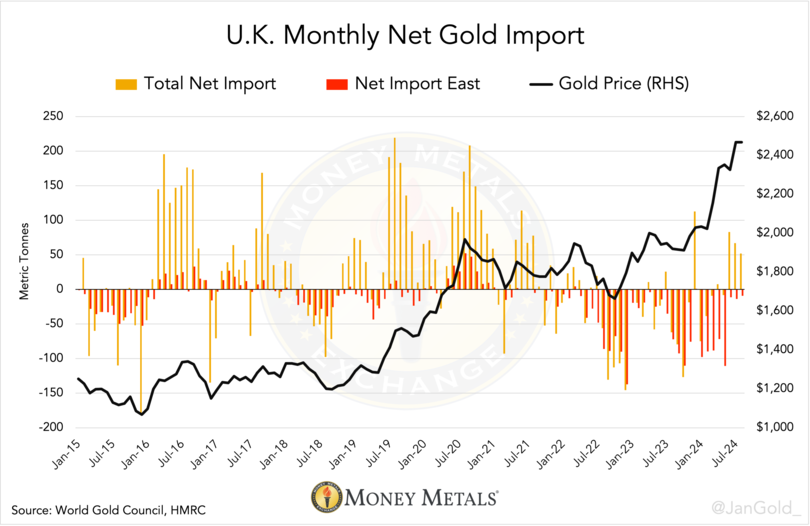
圖表5。 英國的黃金淨進口量及其與東方的淨流量。 許多ETF在倫敦儲存實物黃金。 根據Goldchartsrus.com的資料,英國約35%的淨流量可以歸因於ETF的囤積和不囤積。
西方投資者在市場緊張的情況下購買黃金,使價格迅速上漲。
華爾街正在購買黃金作為金融保險
每當西方將黃金價格與TIPS收益率掛鉤時,黃金進入市場主要是出於投機原因。 投機者不是瞄準,例如,10%的黃金分配,而是評估實際利率(TIPS收益率),並決定黃金是做多還是做空。 歸根結底,這些投機者只關心在價格方向3上進行有利可圖的賭注。
現在,西方投資者已經從這種模式轉向,金價正在上漲。 這表明他們正在改變他們對黃金的看法,即從投機貿易轉變為金融保險。
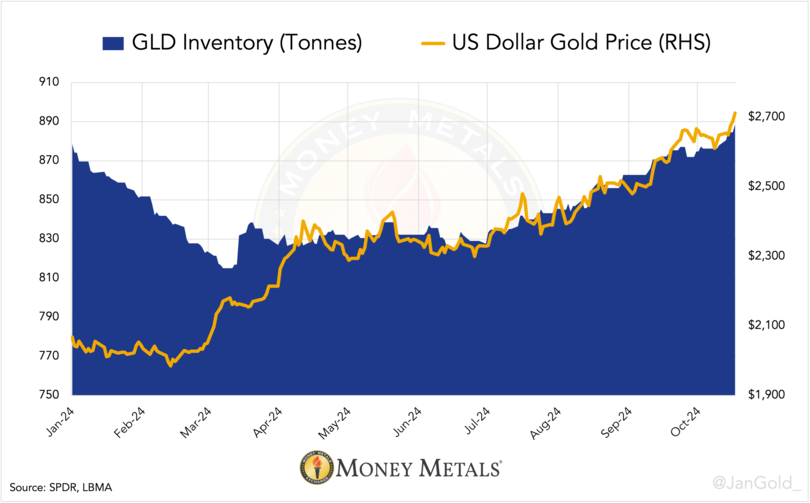
圖表6。 截至2024年10月18日,GLD庫存與黃金價格。
透過使用西方最大的黃金ETF(GLD)的每日資料作為區域情緒的代理,我們可能會得出結論,西方投資者仍在推動黃金上漲。 請注意,這並不意味著西方投資者都購買ETF等衍生品;他們也直接購買黃金。
黃金前景仍然樂觀
2023年,美國銀行(BofA)的一項調查顯示,71%的美國投資顧問建議在0到1%之間進行黃金分配,這幾乎不算什麼。
此外,他們的建議自2017年以來一直沒有改變,儘管消費者價格通脹已經上升到幾十年來的高點,兩場戰爭爆發了,西方凍結了俄羅斯3000億美元的外匯儲備,美國的財政政策已經失控。
這些發展使具有交易對手風險(並且可以無限印刷)的金融工具不那麼受歡迎,這支援擁有實物黃金的情況。
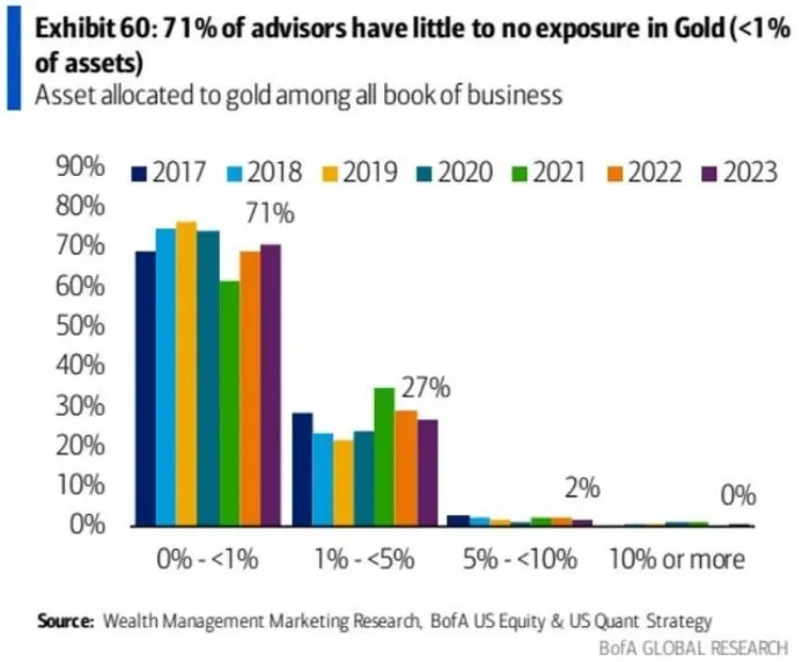
圖表7。 由BofA提供。
在世界黃金理事會(WGC)2024年6月對北美投資者的調查中,一些不擁有黃金的機構表示,他們的障礙之一是“其他大型機構沒有投資黃金。” 華爾街顯然低估了黃金,當所有實體登船並將其投資組合的很大一部分分配給黃金時,價格上漲的空間很大。
幾天前,美國銀行的一位戰略家諷刺地表示,黃金似乎是最後的“避風港”資產地位,激勵包括中央銀行在內的交易員增加風險敞口,因為隨著美國債務水平的上升,國債面臨風險。
“人們對美國資金需求及其對美國的影響的擔憂揮之不去。 美國銀行寫道:“國債市場,黃金屬可能會成為最終的避風港資產。”
總之,讓我們透過研究信貸和黃金之間的長期比率來關注推動黃金的主要原因。
這種方法背後的理由是,當創造過多的信貸時,金融體系會變得不穩定,金價需要上漲,為金融體系增加更多信任並恢復穩定。
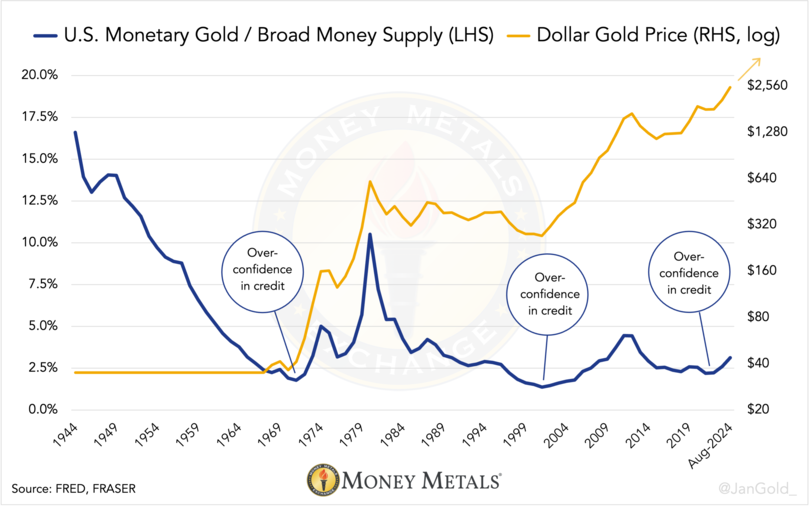
圖表8。 美國官方黃金儲備由廣義美元貨幣供應量(M2)劃分。
過去,每次美國貨幣黃金價值與美元貨幣供應量之間的比率觸底——這意味著相對於政府擁有的黃金,為其貨幣提供可信度,創造了大量信貸——黃金牛市隨之而來。
類似的信用黃金比率表明,我們正處於黃金牛市的第一局。 我們將在即將發表的文章中深入分析這些長期比率。
筆記
- 地緣政治緊張局勢(戰爭和美元武器化)、高債務水平、高昂的股權估值和貨幣貶值。
- 對我來說,TIPS模型一直是不合邏輯的,因為它將名義價格與以百分比計價的利率聯絡起來。 鑑於TIPS收益率適用的美國公共債務總額的增長速度比地面黃金供應快得多,我不明白這種模式是如何可持續的。
- 請注意,黃金市場比上面建議的要大。 現在在倫敦的邊緣買家設定了市場其他部分(礦山供應、珠寶和硬幣需求等)清算的價格。 當黃金與TIPS收益率相關時,投資者可以增加他們的頭寸,但不能增加規模。
訂閱:
文章 (Atom)