
2026年1月4日星期日

2026年1月3日星期六
2026 金融新秩序:巴素爾三協定(Basel III)如何重塑黃金的「無風險」地位

隨着全球金融監管進入最後倒數,銀行業正迎來一場深層次的規則洗牌。根據國際清算銀行(BIS)及全球主要金融監管機構的時間表,2026 年 1 月 1 日將成為一個分水嶺——這一天,巴素爾三協定(Basel III)的最終修訂案(俗稱 Basel 3.1 或 Endgame)將全面實施,正式確立實體黃金在銀行體系中的核心地位。
1. 關鍵節點:2026 年 1 月 1 日
雖然 Basel III 的框架早在十年前開始構思,但由於疫情及各國銀行業的複雜性,歐盟及英國等主要金融中心已正式將最終落實日期定於 2026 年 1 月 1 日。這標誌著銀行必須在此日期前,完成資產配置的調整,以符合最嚴格的資本要求。
2. 實體黃金:正式回歸「零風險」資產
喺新協定嘅框架下(特別係 CRE20 監管文件),黃金嘅待遇出現咗質的飛躍:
* Tier 1 資產地位: 銀行持有嘅實體金條(Allocated Gold,即係存放在金庫、擁有獨立編號且產權明確的黃金),其風險權重(Risk Weight)正式被歸類為 0%。
* 等同現金: 呢意味著喺監管眼中,持有實體黃金同持有現金或政府國債一樣「安全」,銀行唔需要為呢啲資產撥備額外嘅資本。呢項改變大大提高咗銀行增持實體黃金嘅誘因。
3. 紙黃金的末路:成本大幅飆升
相比之下,過往盛行嘅「紙黃金」(Unallocated Gold,未分配帳戶)則面臨嚴苛限制。新協定引入咗淨穩定資金比率(NSFR),對紙黃金產生咗致命影響:
* 高昂的資金成本: 銀行持有嘅紙黃金被視為風險較高的 Tier 3 資產。新例要求銀行必須為呢啲「紙面部位」配置高達 85% 的穩定資金作為支撐。
* 去槓桿化: 以往銀行可以用極低成本操作大規模紙黃金交易,但 2026 年後,呢種做法會令銀行嘅資產負債表變得非常沉重。因此,銀行正被迫將「紙面」資產轉化為「實體」資產,或者乾脆縮減紙黃金業務。
4. 對市場的長遠影響
呢次「撥亂反正」將會產生三個深遠影響:
* 實體需求大增: 全球商業銀行為咗符合 2026 年嘅監管指標,會持續將紙金合約轉為實體金儲備。
* 定價權轉移: 黃金定價可能從過往嘅「期貨/紙面交易」主導,慢慢轉回由「實體供需」主導。
* 金融穩定性提升: 減少咗銀行體系入面因「虛擬黃金」過度槓桿化而引發嘅系統性風險。
結論
巴素爾三協定喺 2026 年嘅全面落實,係黃金回歸「貨幣屬性」嘅重要里程碑。對於投資者嚟講,呢個轉變確認咗一個事實:實體黃金唔再只係商品,而係銀行體系中無可取代嘅「硬通貨」。
可以參考以下來源作進一步確認:
* BIS (國際清算銀行): https://www.bis.org/bcbs/publ/d599.pdf(關於實施時間表)
* WGC (世界黃金協會): https://www.gold.org/goldhub/gold-focus/2021/06/basel-iii-and-gold-market (關於 NSFR 對紙黃金的影響)
* LBMA (倫敦金銀市場協會): 關於 2026 年實施期限的官方公告。
2025年12月24日星期三
白銀傳統套利機制 (Arbitrage) 的崩潰。


SHFE (上海) 與 COMEX 出現歷史性 5.6價差(常態<2)
邏輯推理:
1️⃣ 信號: 價差遠超物理運輸與交易成本。
2️⃣ 期望值: 當前環境下,從 COMEX/LBMA 提取實物並轉移至 SHFE 具有極高的不對稱回報。
3️⃣ 貝葉斯更新:
先驗概率 (Prior):「COMEX 主導定價」的信念正在瓦解,
新的後驗概率 (Posterior) : 「東方實物供需」將主導價格發現。
西方的紙白銀正面臨流動性枯竭。
這不是一次性的價差,而是全球白銀定價機制的轉換。
歡迎來到實物為王的新時代。
#Silver #Commodities #Arbitrage #SHFE #COMEX
金價突破 $4,500,「黃金/現金」比率已正式突破 1980 年歷史峰值。
金價突破 $4,500,「黃金/現金」比率已正式突破 1980 年歷史峰值。
➡️ 確認訊號: 法幣購買力崩解已進入新階段。
🎲 期望值視角 (The EV):
大眾恐高,但從資產相對強弱來看,這是誤判。
黃金/美債: 距離 1980 峰值仍有 -17% 空間。
黃金/美股: 距離 1980 峰值仍有 -50% 空間。
邏輯思考:
市場看的是絕對價格 (Nominal High),
真正在於看懂相對估值 (Relative Value)。
若歷史具備均值回歸 (Mean Reversion) 特性
黃金相對於金融資產仍處於「低估」區間。
即便漲幅已達 +119%,在相對估值的邏輯鏈下,
賠率 (Odds) 依然還在。
⚠️ 賠率不是勝率!
⚠️ 不要做 boy genius 去 fade

2025年12月23日星期二
Silver just outperformed Alphabet and now is 4th place 🤫
Silver just outperformed Alphabet and now is 4th place 🤫

2025年11月27日星期四
Why I’m Betting on a 10x Surge in Silver----Jesse Colombo
In today's report, I want to talk about an exciting prospect that I firmly believe in and am personally investing in. I expect silver to surge at least tenfold from its current price, which would mean a move from around $53 an ounce today to at least $500 an ounce.
To understand this setup, let’s start by looking at the long-term price chart of silver going all the way back to the 1960s. Next, I want to draw your attention to the critical $50 level, which marked the peaks of the last two major silver bull markets in 1980 and 2011, both of which were followed by significant declines.
But a major development is happening as we speak as silver finally breaks above the all-important $50 psychological level. This signals the start of a powerful new secular bull market, which typically lasts for a decade or more. That indicates silver still has a long way to run.
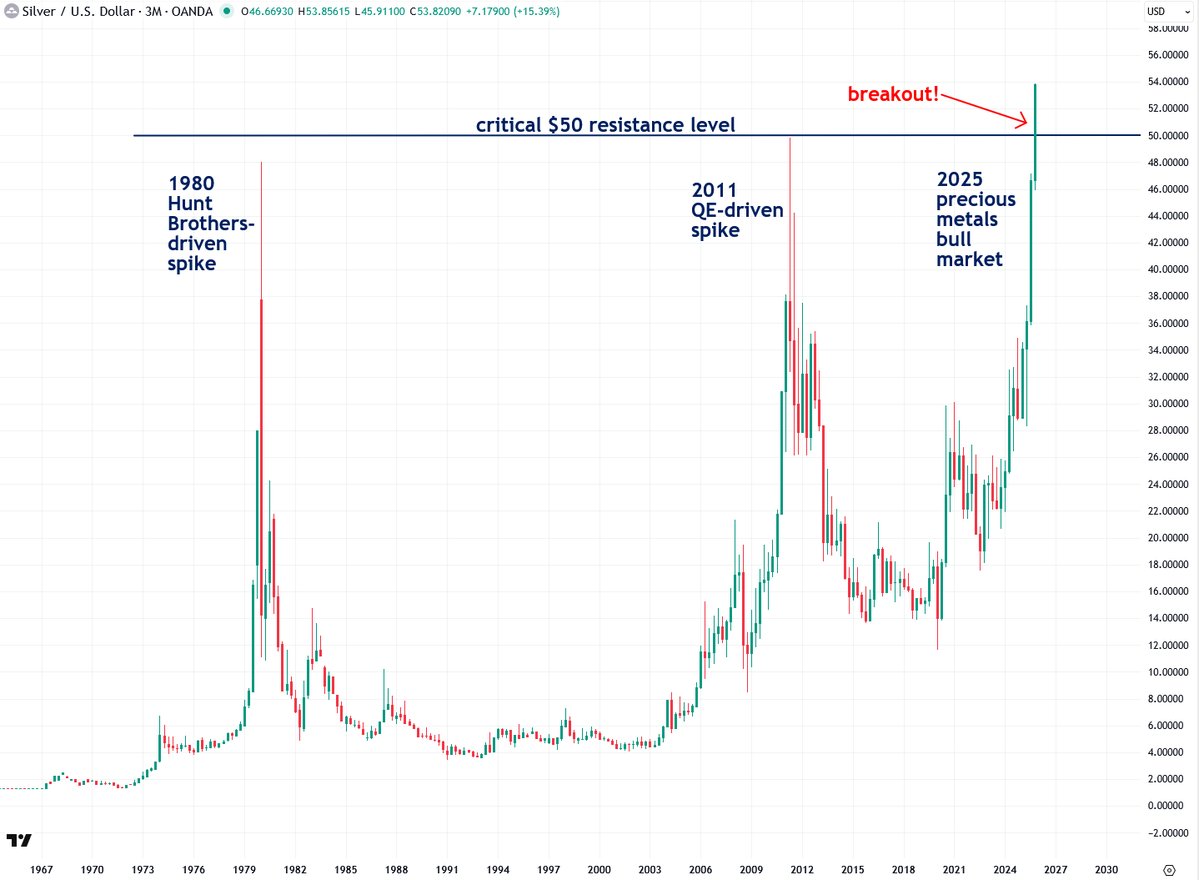
With silver now trading above $50, an all-time high, no one who has ever purchased silver is currently sitting on a loss.
I believe this breakout is about to spark a major shift in investor sentiment toward silver, which has long been viewed as a lagging and underperforming asset compared to flashier alternatives like high-flying tech stocks and cryptocurrencies.
Many of the new investors that are about to enter the silver market will come from the younger generations that aren’t burdened by the past disappointments of 1980 and 2011 that shaped the views of older, battle-weary silver investors.
Although investment demand for silver has been subdued over the past decade, I expect it to increase significantly as the bull market continues to strengthen. U.S. silver ETFs, in particular, have only recently started accumulating silver more actively.
For example, the iShares Silver Trust (SLV), the largest U.S. silver ETF, increased its physical holdings from 417.5 million ounces to 496.53 million ounces over the past two years. That 19% rise is modest compared to the 160% surge in silver prices over the same period. I believe that gap will close soon, driving silver prices much higher.

There are many reasons why I expect silver to surge from here rather than fall from the $50 level as it did in 1980 and 2011. One key reason is that silver remains far cheaper in real terms today compared to those past peaks when measured against a wide range of benchmarks. This indicates that silver still has substantial room to rise.
To further reinforce my point above, I also want to show you the ratio of silver to the U.S. M2 money supply, indexed to 100. This may be an even more accurate measure of inflation than the more commonly used Consumer Price Index (CPI). After all, the root cause of inflation is growth in the money supply itself. As Milton Friedman, the Nobel Prize–winning economist, famously said, “Inflation is always and everywhere a monetary phenomenon.”
This chart shows that although silver has just surpassed the same nominal price of $50, its real-world price is much lower than it was in 1980 and 2011. For example, in 1980 the ratio was 1,038, in 2011 it was 176, and now it is just 66. I see this as clear evidence that, despite its recent gains, silver’s bull market is nowhere near being long in the tooth.

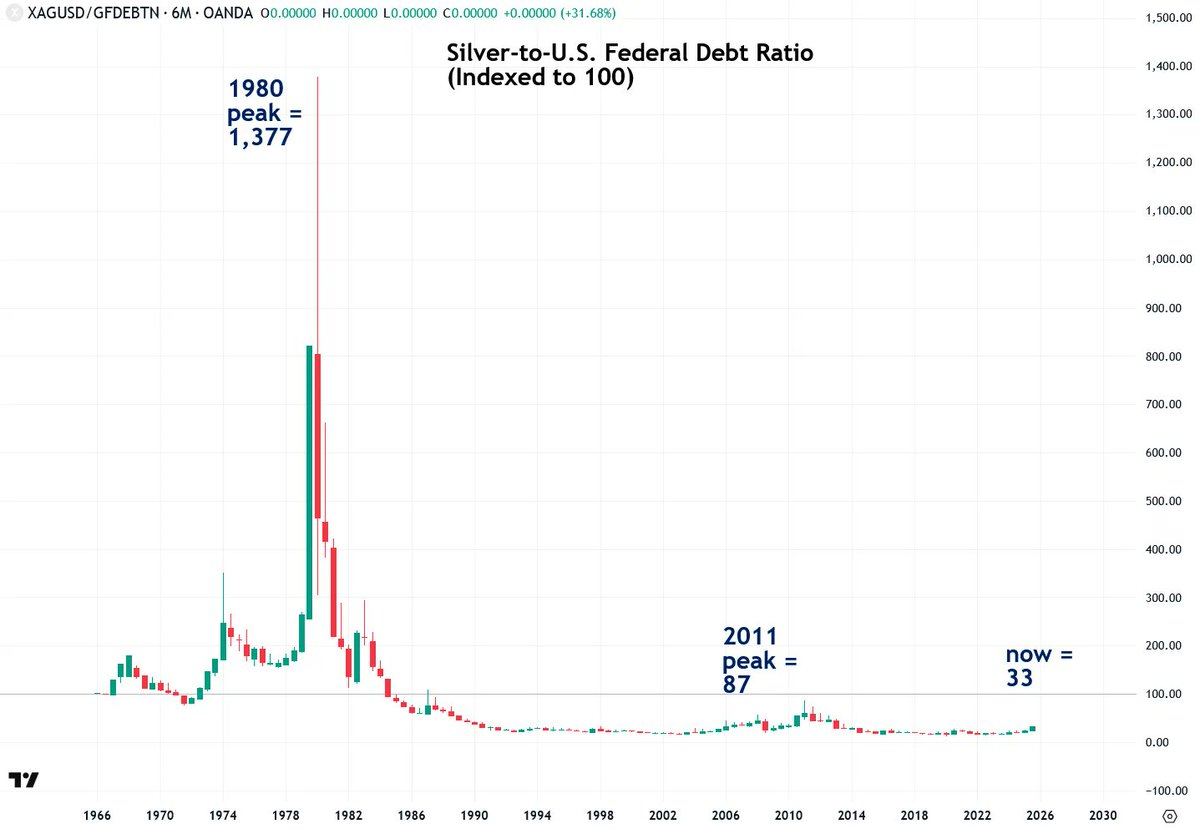
Another eye-opening metric that confirms silver is still extremely cheap is the ratio of silver to the U.S. national debt, which now stands at $37.8 trillion and is growing at an alarming pace of $1 trillion every 100 days with no signs of slowing. This is an important metric because it shows whether the price of silver has kept pace with the growth of the national debt, and the answer is clearly no.
If you’re enjoying this free sample report and want more content like it, there’s plenty more where that came from.
Just to sign up as a free or paid subscriber to my bestselling precious metals and economic crisis-focused newsletter, The Bubble Bubble Report.

The chart, indexed to 100, shows that this ratio was 1,377 at the 1980 peak, 87 at the 2011 peak, and only 33 today. This indicates that silver has substantial room to catch up to the expanding national debt. In that context, $53 silver is not expensive by any measure, and a move to $500 an ounce is far from inconceivable.
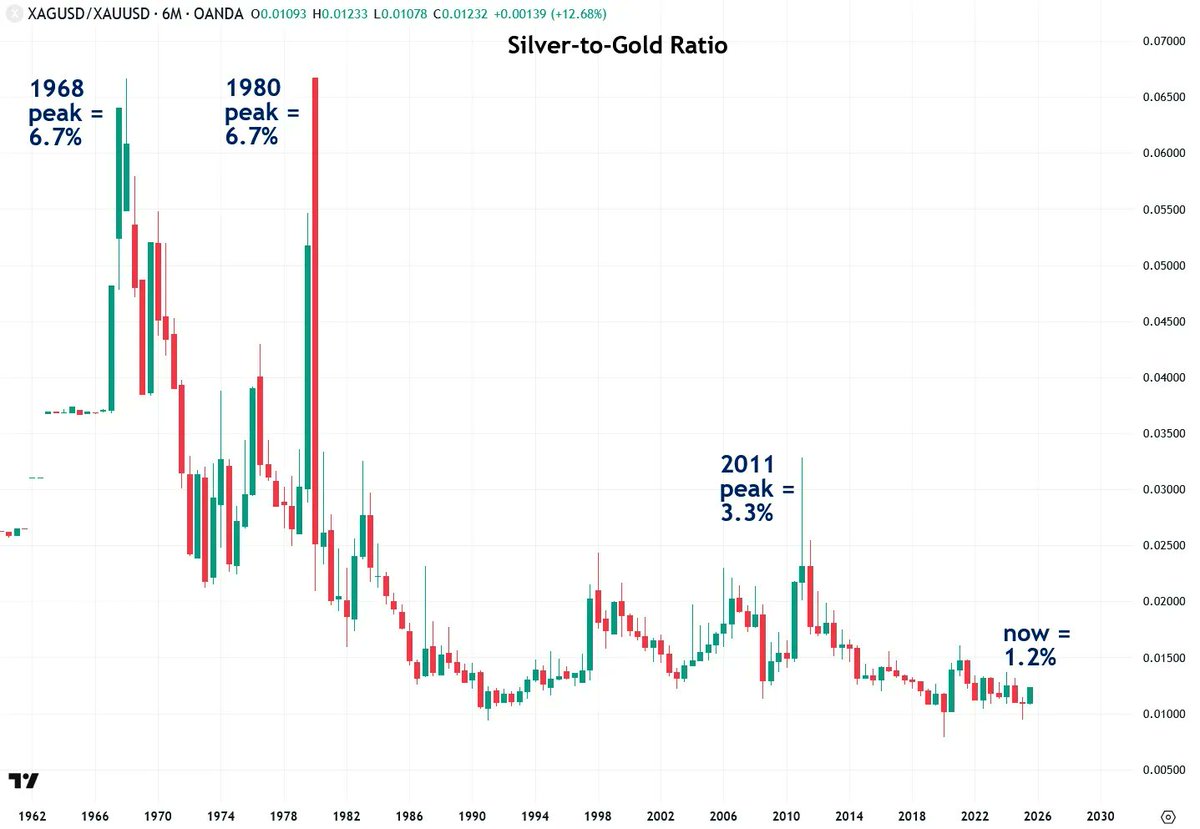
Next let’s move on to another metric that confirms that silver is still much cheaper today than it was at the peaks in 1980 and 2011, despite its recent gains. This time, we will look at the silver-to-gold ratio, which is a useful way to determine whether silver is undervalued or overvalued relative to gold, the leading benchmark in the precious metals market.
While gold has always been more expensive than silver throughout history, the gap between them has varied significantly. At the 1980 peak, silver was 6.7% of the price of gold. At the 2011 peak, it was 3.3%. But now, silver is just 1.2% of gold’s price, which is far below historical levels.
This indicates that silver is extremely cheap by historical standards and still has substantial room for its bull market to continue.
Now let’s get to the core reason why I believe silver will surge at least tenfold from here, reaching $500 an ounce or more. And that reason is the powerful chart pattern silver has been forming over the past six decades, known as a cup and handle.
Because of the magnitude of that pattern in both duration and scale, it indicates that silver is set to rise by a massive amount to match its proportions.
The $50 resistance level marked the top of that pattern, and as of this week, silver has finally broken above it. This breakout signals the start of what will be the largest bull market in silver’s history. It is a rare opportunity that no investor should overlook. I’m personally heavily invested in both physical silver and silver mining shares, which are leveraged to the price of silver.

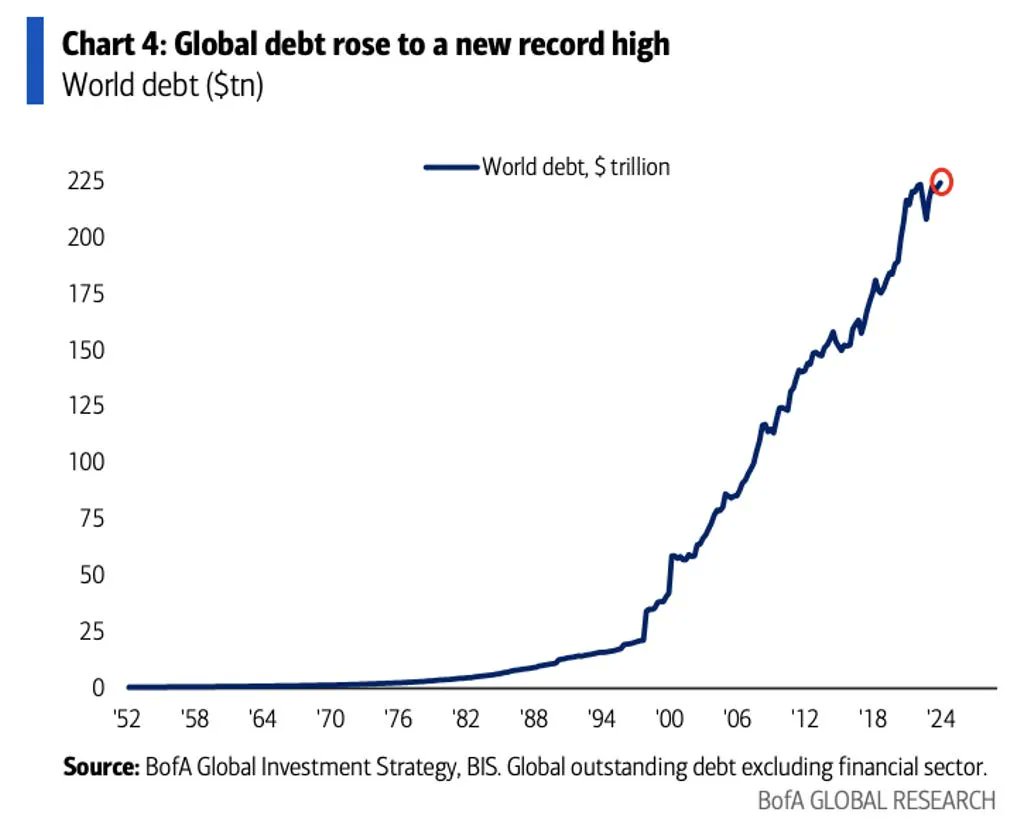
And if you think a tenfold surge in the price of silver from here sounds far-fetched, it’s really not. There are several reasons for this, starting with how undervalued silver remains. But more importantly, we are facing a runaway global debt crisis. As you can see in the chart below, global debt has soared from just $25 trillion thirty years ago to an astounding $250 trillion today.
Unfortunately, this number is poised to rise even more sharply from here, approaching a near-vertical trajectory. This kind of exponential debt growth is a hallmark of the final stages of fiat or paper currency systems, and will cause a massive global financial and monetary crisis that will send silver into the stratosphere. In that scenario, $500 an ounce is not only realistic, it could prove conservative once the coming hyperinflationary storm fully takes hold.
To summarize, I’m extremely excited about silver’s prospects over the next five to ten years. As of this week, silver is beginning its most powerful bull market yet.
I’ve made my case with multiple factors, including how undervalued silver remains by various measures, the anticipated influx of capital from U.S. ETFs, the accelerating global debt crisis, and the extremely promising technical setup implied by the six-decade-long cup and handle chart pattern.
At this point, I believe everyone should own at least some silver—even if it’s just a few ounces.
If you found this report valuable, it’s just a small preview of the kind of content subscribers to my best-selling newsletter, The Bubble Bubble Report, receive regularly.
Kind regards,
Jesse Colombo
Precious metals analyst and investor. Advocate for free markets and sound money. Recognized by the London Times for predicting the 2008 Global Financial Crisis.
Disclaimer: the information provided by Jesse Colombo, The Bubble Bubble Report, and related content is for informational and educational purposes only and should not be construed as investment, financial, or trading advice. Nothing in this publication constitutes a recommendation, solicitation, or offer to buy or sell any securities, commodities, or financial instruments.
訂閱:
文章 (Atom)