【on.cc 東方互動 專訊】 道瓊斯報道,黃金礦業服務公司(GFMS)援引調研活動搜集的證據稱,今年第二季度中國的黃金需求可能回落。
根據接受GFMS調查的加工廠和貿易參與者,中國二季度黃金需求似乎已經放緩,儘管近期的海關數據指向相反。
GFMS稱,對現有的海關數據進行分析可知,今年從香港流入中國大陸的黃金大幅增長,今年頭五個月的同比增幅達到700%以上 。
但該公司指出,從貿易行業的多個渠道搜集的消息顯示,不斷增長的香港與大陸之間的黃金迂迴交易(當地公司利用黃金開展外匯和利率套利),使得香港黃金出口量數據嚴重虛高。[DJ]

2012年8月16日星期四

2012年8月15日星期三
The Gold Price for the Next 16 Years
The high rate of debasement of paper currencies ensures the gold
price trend will be solidly up until interest rates rise sharply, to
maybe 15% in 2028.
Dr David Evans, 13 Aug 2012
Gold is monetary. It is the main non-government currency, evolved in the marketplace over 5,000 years.
If
you want shiny yellow stuff for jewelry, there are plenty of cheaper
alternatives—jewelry is made of gold because gold is valuable, and gold
is valuable because it is money. Gold is not a commodity like wheat or
iron, because it does not get used up—nearly all the gold ever mined is
still available for sale at the right price. Nor is gold an investment
that produces goods and services, like farms or factories—it is just a
medium of exchange, like cash.
Gold becomes a good investment only when the other currencies are failing, inflating, and debasing. This is one of those times.
Caveat: We
examine the best case for the central banks and official sector, where
they stay in control of the system and successfully guide it through a
period of financial repression. We estimate how long that needs to be,
and why. Of course, much could go wrong along the way, but in the
absence of an extreme shock or major miscalculation the future might go a
lot like this.
Manufacturing Money
There is
a lot more money around today than there was 30 years ago; a billion
dollars used to be a lot of money, but now we talk of trillions. So
someone has been manufacturing a lot of money.
In the modern money system, there are two sorts of “money”. First is base money, which is physical cash or the numbers in an account at the central bank. It is created out of nothing by government, by fiat.
Technically there are no constraints on its manufacture, but in
practice it is moderated by the desire not to raise inflationary
expectations. It is about 5 – 10% of today’s money.
Secondly, there is bank money,
which is numbers in bank accounts at commercial banks. In essence bank
money is a receipt for base money—if you deposit a $100 note, the bank
increases the number in your bank account by 100. (The banks themselves
call this money “credit”, which can be confusing because “credit” has
other meanings.) A little bank money is created by cash deposits, but
the vast bulk of it is created when commercial banks make loans—which
they do by simply increasing numbers in bank accounts. Thus, nearly all
bank money is created out of nothing by commercial banks when loans are
made. (The banks then charge interest on the newly created bank
money—great business model!) Bank money constitutes about 90 – 95% of
today’s money. Most commercial transactions today just move bank money
between bank accounts.
The manufacture of bank money by lending is
moderated by the obvious problem that if a bank issues more receipts
than it has cash, too many customers might withdraw cash at once and the
bank would be broke—with no cash, but owing cash to its account
holders. It has long been established by trial and error that in normal
times a bank can issue about 10 times as many receipts (that is, make
loans of bank money) than it has base money, because not all its account
holders will show up at once wanting cash. Central banking and
government guarantees reduce this risk further, and modern bank runs are
rare.
This ratio of bank money to base money illustrates the
notion that the base money is “amplified up” tenfold by bank money. It
is called fractional reserve banking. However since about 1990 the manufacture of bank money in western countries has been constrained instead by the Basel Accords,
which limit the amount of bank money a commercial bank can create using
a formula based mainly on the equity capital of the bank, the riskiness
of its loans, and the amount of depositor’s funds. Although banks still
technically must obey reserve requirements as well, they are mainly
irrelevant due to modern practices like retail sweep and lending of
reserves. The Basel Accords can be loosely thought of as limiting the
ratio of bank money created by commercial bank lending to about 20 times
the amount of base money in circulation.
So the current
government currencies are a fiat base, amplified by a modified
fractional reserve system. Both parts create money out of nothing: base
money is created by the central bank, and bank money is created by the
commercial banks. Historically, any money system where money can be
created from nothing is unstable because it eventually gets much
debased—and they tend to last on average about 50 years. Each part of
our current system is unstable in its own right, and the current system
is just 41 years old. What could possibly go wrong?
Our Debt Crisis
Our
current money system essentially started in 1971, when Richard Nixon
cut the last link to gold, which allowed unconstrained manufacture of
base money for the first time in the West. The stagflation of the 1970s
dealt with the inflationary consequences of the 1960s, then the system
was reset in 1980 by 20% interest rates—which halted money manufacture
by making it very expensive.
Banks and government then proceeded
to blow the deepest and most global monetary bubble in history, by (1)
keeping interest rates as low as possible such that CPI did not rise,
but ignoring asset inflation, (2) changing banking rules to make money
manufacture ever easier and cheaper, and (3) responding to each crisis
by bailing everyone out with cheap loans of new money.
We can
measure the size of the bubble. Since the vast bulk of money is bank
money created by lending, the amount of money is roughly the amount of
all debt, both government and private. The size of the economy is its
GDP, so the size of the bubble is the debt-to-GDP ratio (for all debt,
not just the debt of the national government). We will discuss the US
figures because those are easily accessible and of good quality, but the
ratios for other western countries are similar.
Normally the
ratio is about 150%—the amount of money is about 1.5 times the GDP.
There are two notable exceptions. The first was the roaring 20’s, when
the ratio soared. At 235% in 1929 the market crashed, and ushered in the
Great Depression of the 1930’s. The ratio returned to the usual 150% by
1950, and strong real growth followed.
The second exception
started in 1982, when the ratio started soaring again. By 1987 it
reached 235%, and again there was a market crash. In contrast to 1929
when the central banks let the money supply fall rapidly as businesses
and banks went bust, Fed Chairman Alan Greenspan flooded the markets
with liquidity. The real economy shrugged off the market crash after a
couple of years, and the ratio soon resumed its ascent, rising strongly
until 2008 when it peaked at 375%.
Now nothing can move away from
its normal value forever, but why did the ratio stop rising in 2008?
Basically the world ran low on borrowing capacity. There was no longer
enough income to service the debt (debt was roughly 400% of GDP and
paying around 4%, so interest payments were around 16% of GDP). Also,
the world was running low on the unencumbered collateral required to
take out a loan. The manufacture of money by commercial banks stalled,
which brought on the global financial crisis (GFC). Governments promptly
stepped in to take up the slack in money manufacture, lowering interest
rates, borrowing, and printing a little (“quantitative easing”).
What Now?
In
2012 the ratio is still stuck around 375% and governments cannot borrow
much more. Worse, the world is finally realizing that the private
sector is debt-saturated, and that there is no return to the pre-2008
“normal”. Most everyone making financial decisions today grew up in the
bubble, which started in 1982. All we know is the bubble, when loans
were easy to get and the amount of money was increasing quickly. But
monetary history tells us that the period 1982 to 2008 was very unusual.
Many people now realize that we cannot go back there.
There is an important constraint that is often overlooked. Last year’s debt has to be repaid with interest,
so each year the money supply must increase or there will be widespread
business and bank failure. It’s like a game of musical chairs—if there
isn’t as much money as last year, plus some extra to pay interest, then
arithmetically not everyone can pay back their loans. (We don’t
literally have to pay back and re-borrow our loans each year, but for
big business loans it is effectively like that because the banks are
looking over their shoulder and will demand immediate repayment if they
get nervous.) If a lot of businesses cannot repay their loans, then some
banks will go bust and more businesses will go bust. This is what
happened in 1929 – 1932.
But if the private sector cannot
manufacture more bank money by borrowing from commercial banks, the only
way for more money to be manufactured is for government to manufacture
base money.
So the world is now, in 2012, at an important fork in
the road: Either print and inflate, or allow the amount of money to
decrease and suffer widespread business and bank failure. Inflation or austerity. The
first path is one of continued currency debasement that keeps the
economy stronger in the short term; the second responsibly stops the
monetary debasement but 1930’s style failures will ensue.
This is
the sort of mess that always eventuates when currency is debased. There
is no painless solution; the day of reckoning can only be put off and
drawn out. Philosophically, money is a promise, of similar purchasing
power anytime in the future. Work is motivated by these promises. But
too much money has been manufactured—too many promises have been made.
Not all debts can be repaid in dollars near their current value –not all
those promises can be kept. There are going to be many losers. The
political system, not the usual economic rules, will determine who the
losers will be, because the politicians will change the rules as we go.
Politicians Will Choose Inflation
It’s
the basic democratic calculus: Lenders are few, but borrowers are
many—they vote, and they might riot. Further, all big businesses borrow
money so powerful business interests will push for an inflation so they
can pay back their loans in smaller dollars. The Keynesian fog will be
invoked to excuse the inflationary choice, something like “reducing the
people’s debt burden”.
Ben Bernanke, present Chairman of the US
Federal Reserve, is a student of the 1930s depression and blames it on
the drop in money supply—he has made it clear that his Fed will not
allow a 1930’s deflation. Academic economists in the US who strongly
influence economic policy, such as Rogoff and Mankiw, are already
suggesting running a mild inflation of maybe 6% for a few years.
Government spending in most western countries is considerably more than
tax receipts, giving governments extra incentive to print (when
governments print to make up for insufficient tax receipts, price
inflation quickly follows—this is what drove the German inflation of the
early 1920s). And finally, most western governments are already deeply
in debt and face huge interest bills, so they want low interest rates.
Gold
Gold
enforces honesty, because you have to earn it before you can spend it.
No one can conjure it up for little effort, and even digging it out of
the ground often takes almost as much effort as it’s worth. Gold is an
anti-cheating device, because when someone cries “bullshit” you’ve
either got it or you haven’t.
In particular, banks and government
cannot print it. And who hates gold? The monetary elite and governments
prefer their dishonest money. They enjoy the first use of the new money,
spending it before it pushes up prices. Governments can print to cover
their debts if necessary. For centuries the greatest game in banking has
been to buy assets in a sector, approve more lending for purchases in
that sector, then sell their assets when the prices subsequently rise,
then cut off lending into the sector and watch the prices fall—rinse and
repeat every few decades.
Banks and governments bash gold. For
the last 15 years most large financials have been predicting gold prices
a year hence as 10% less than whatever it was at the time—but
considering that gold has been rising at 21% p.a. for the last ten
years, a track record that bad is hard to acquire by accident.
As
any currency trader knows, the long term value of currencies is
determined mainly by their relative rates of manufacture (or
debasement). Since 1982 the amount of above-ground gold has been
increasing at just over 1% p.a., while the amount of the main paper
currencies has average growth around 12% p.a. In 2007 the Australian
broad money supply grew at 23% (yet CPI was less than 3%).
Some
say gold is in a bubble. Not so. A bubble suggests that some ratio or
pricing metric has moved up away from its normal value, and later
reverts to its mean. But gold always debases much more slowly than any
paper currency, so basically gold goes up forever against paper
currencies, at an average rate equal to the difference in their rates of
debasement. A gold price of one million dollars per ounce is only a
matter of time—but will it take 50 years or 500 years?
By
historical standards, the price of gold is now low. In the gold rushes
of the 1850s, it was worth leaving the city to sail on a wooden boat for
three months, then live in the wilderness scratching in the dirt for a
few ounces of gold per year. What gold price would it take to get you to
do that today? Modern gold mining is a highly mechanized business yet
it is barely profitable.
The total amount of debt in the world in
2011 was around 210 trillion USD, and the world’s GDP was 60 trillion.
Yet the value of all the gold ever mined, going back to the Egyptians,
is just 9 trillion USD. If gold ever re-enters the official financial
system, it will have to move up in value quite considerably.
The
last gold price rise was 1968 – 1980, when it rose from 35 to 800 USD
per ounce. What stopped its rise then? Overnight interest rates around
20%, which made paper currencies attractive and stopped their
debasement. Presumably it will take similar interest rates to again stop
the rising gold price. But nobody today can afford to pay 20% interest
rates, especially governments, so gold is going to keep trending up for
quite a while.
Forecast to 2028
We can
calculate how long the upcoming inflation will last and how high gold
will go, based on a few reasonable assumptions. The usual caveats about
forecasting apply, and if the central banks lose control of the
situation we are likely to veer off either into hyperinflation (more
likely) or depression (less likely). But let’s be optimistic and assume
they successfully chart the most politically feasible course.
Debt
levels are currently around 375% of GDP, but need to revert to their
normal level of 150%. This requires a 60% reduction in the real value of
debt.
Let’s suppose we get inflation cranked up by 2014, that we
run a 1970s high but tolerable inflation of around 12% (which the modern
CPI is likely to register as only around 5 – 8%) ,and that interest
rates are around 6%. Then the real interest rate is -6%—so it takes 14
years to reduce the value of debt by 60%.
To end the inflation,
governments must make a credible commitment to halting the rapid growth
in the stock of money: they must raise interest rates sharply, to maybe
15 – 20%. The gold price will continue trending up until that happens,
so until then gold investors can relax (ok, the ride might be volatile).
But when real interest rates go strongly positive, it’s time to get out
of gold ?
Gold has been rising at a remarkably steady 21% p.a.
for the last ten years. About 11% of that might be due to the current
debasement differential, while the rest might be a combination of catch
up for the period 1980 – 2001 when the gold price fell substantially in
real terms, fear over the possible abandonment of paper currency, and
the possibility that gold will re-enter the official money system. Under
the scenario outlined above, the rate should remain roughly similar.
Assuming gold continues to rise at an average of 21% p.a.:
| Nominal price in USD/oz | Price in today’s money, USD/oz | |
| 1980 |
850
|
3,300
|
| 2001 |
260
|
360
|
| 2012 |
1,800
|
1,800
|
| 2015 |
3,800
|
3,000
|
| 2020 |
10,000
|
4,600
|
| 2025 |
25,000
|
6,100
|
| 2028 |
50,000
|
8,400
|
Don’t let the nominal prices bedazzle you. Due to the inflation, a
dollar of 2028 is only worth 17 cents in today’s money, so the peak
price of $50,000/oz is only around $8,400/oz in today’s money.

A Silver Hoard Near Record High Has Transnational Silver Abusers Concerned
http://silvervigilante.com/

Since the first three months of 2012, silver has, for the lion’s share, been held under the $30 mark. Until March, silver appeared to be heading back towards $50 an ounce, its previous high, after climbing above $36. This was short-lived. Now, analysts, based on a survey by Bloomberg, expect the price of silver to average $33.02 an ounce in the fourth quarter. Despite any bias that a panel chosen by Bloomberg might encompass, silver remains on a long-term trajectory poised to continue its peak-every-two-years model.
The long-term, to be sure, is only in terms of human lifespans, for already the silver price has sat well-off its recent high in April of 2011 for a year-and-four months. That would mean that, although silver might have a doldrum 2012, it would then begin to rise significantly in early 2013. The price of silver will average $33.02 an ounce in the fourth quarter, 18 percent higher than its current price, according to the median of 13 analyst estimates compiled by Bloomberg. Silver could then easily be poised for a 100-150% rise in price in early spring 2013, landing it at least around $66 per ounce.
But, some hedge funds are predicting an economic slowdown which they surmise will curb demand for silver. On the opposite side of the rope in the tug-of-war for silver, many monied investors and main street investors are anticipating a price rise based on the implementation of global quantitative easing, spearheaded by the Federal Reserve. The price of silver tripled when the Federal Reserve purchased $2.3 trillion of debt through Quantitative Easing 1 and Quantitative Easing 2 from December 2008-June 2011. One can tease also from the chart below that in the late summer of 2007, as there was a stealth Q.E., silver responded predictably.

Much of the Bloomberg article is focused on the “schizophrenic” model for silver, which is a seriously flawed axiom from which to look at the silver price. Silver’s history is one much longer than that of Industrial Society. Industry has created novel demand for silver. And so, therefore, is predisposed to act as upward price pressure in the long run. Even if there were a complete collapse of industry in the world, in the fog of a broken price mechanism, silver would retain desirability. It would be psychologically comforting to many to default onto the money of their forebearers. Silver will be one item of many that has cultural relevancy were there to be an industrial collapse. It would be one of few with history as money.
“Since the beginning of the year it has reacted more like a base metal than a precious one,” said Frederique Dubrion, the Geneva-based president and chief investment officer of Blue Star Advisors SA, which manages metals and energy assets. “The main negatives are still in industry. We’re waiting for more quantitative easing, and that would be really positive.”
The idea that quantitative easing is the only basis for a rise in the price of silver is preposterous. What about war? An open war with Iran would send gold up, and then also increase industrial and fear demand for silver. Gold could head up towards $1900 if there is a further breakup of plans for an European Stability Mechanism (ESB). That would mean a price rise for silver. Quantitative Easing alone is not the only reason to expect silver to increase in price.
The silver price tumbled 29 percent from February-June 2012, but, as Bloomberg points out, the metals volatility is “masking what are already historically high prices.” Despite that silver is trading 44 percent below its recent high of $49.85 of April 2011, the two-decade average for the devil’s metal is $9.97.
“Industrial demand may remain weak at least for another six months,” said Jochen Hitzfeld from UniCredit SpA in Munich. “This makes the gap that investors have to absorb even higher,” said Hitzfield, who forsees an average 2012 Q4 price of $28.
Investors purchased 797 tons via silver-backed ETPs this year and are now holders of 18,093 tons, if one does not want to question the solvency of COMEX.That is more than eight months of global mine output. Investors sold a net 812 tons out of ETPs last year. Total silver assets are currently 2.9 percent below the record 18,639 tons reached in April 2011, and Barclays and Morgan Stanley predict that investors will buy 500 more tons in 2013. Hedge funds are adding to their depressed silver position, too. They doubled their net-long position to 9,323 futures and options in the two weeks leading into Aug. 7, according to the CFTC, although this is still 58 percent below the five-year average, a figure which clearly signals that more shorts have accrued as the global awakening in the wake of the 2008 banker-wealth confiscation, as well as the associated fear trade, has put the spotlight on silver and precious metals.
Although silver is usually tagged as schizophrenic metal due to its dual monetary and industrial applications, it really might be the options traders who are schizo. For example, the most held contract offers the right to buy silver at $50 per ounce by November 2013, whilst the next two biggest enable holders to sell silver at $20 by November 2013 and November 2012. For a comparison, the five largest gold options are all for purchases at higher than today. Those silver positions suggest that there is a tug-of-war taking place over the silver price.
The 100-day historical volatility for futures in silver is at 30.8 percent, which is a volatility more pronounced than gold, platinum, palladium and the main industrial metals traded on the London Metal Exchange. All these dynamics with the vast majority of the retail public not taking part in this popular investment – less than 1%.
All of this absolutely worries the powers-that-be embodied in the Silver Users Association. Already in 2006, pre-crisis, Silver Users Association was expressing concern to the CFTC regarding the new derivative products pertaining to silver. They worried a dry-up in the physical would cause them to lose control of the precious supply.
Appearing
on November 9, 1998, “India Silver Hoarding Worries Users Group,”
penned by Silver Users Association spokesman Walter Frankland, stated:
That,
alongside short-and-medium term speculation, is why investors’ holdings
are near a record high set last April for silver, despite that hedge
funds are the least bullish on silver in nearly four years. In the
medium-term, speculators have reduced bets on higher silver prices by 72
percent since the end of February, according to U.S. Commodity Futures
Trading Commission data. Silver products held in exchange-traded funds,
however, have increased three straight months and now totals $16.2
billion, according to Bloomberg.
Since the first three months of 2012, silver has, for the lion’s share, been held under the $30 mark. Until March, silver appeared to be heading back towards $50 an ounce, its previous high, after climbing above $36. This was short-lived. Now, analysts, based on a survey by Bloomberg, expect the price of silver to average $33.02 an ounce in the fourth quarter. Despite any bias that a panel chosen by Bloomberg might encompass, silver remains on a long-term trajectory poised to continue its peak-every-two-years model.
The long-term, to be sure, is only in terms of human lifespans, for already the silver price has sat well-off its recent high in April of 2011 for a year-and-four months. That would mean that, although silver might have a doldrum 2012, it would then begin to rise significantly in early 2013. The price of silver will average $33.02 an ounce in the fourth quarter, 18 percent higher than its current price, according to the median of 13 analyst estimates compiled by Bloomberg. Silver could then easily be poised for a 100-150% rise in price in early spring 2013, landing it at least around $66 per ounce.
But, some hedge funds are predicting an economic slowdown which they surmise will curb demand for silver. On the opposite side of the rope in the tug-of-war for silver, many monied investors and main street investors are anticipating a price rise based on the implementation of global quantitative easing, spearheaded by the Federal Reserve. The price of silver tripled when the Federal Reserve purchased $2.3 trillion of debt through Quantitative Easing 1 and Quantitative Easing 2 from December 2008-June 2011. One can tease also from the chart below that in the late summer of 2007, as there was a stealth Q.E., silver responded predictably.
Much of the Bloomberg article is focused on the “schizophrenic” model for silver, which is a seriously flawed axiom from which to look at the silver price. Silver’s history is one much longer than that of Industrial Society. Industry has created novel demand for silver. And so, therefore, is predisposed to act as upward price pressure in the long run. Even if there were a complete collapse of industry in the world, in the fog of a broken price mechanism, silver would retain desirability. It would be psychologically comforting to many to default onto the money of their forebearers. Silver will be one item of many that has cultural relevancy were there to be an industrial collapse. It would be one of few with history as money.
“Since the beginning of the year it has reacted more like a base metal than a precious one,” said Frederique Dubrion, the Geneva-based president and chief investment officer of Blue Star Advisors SA, which manages metals and energy assets. “The main negatives are still in industry. We’re waiting for more quantitative easing, and that would be really positive.”
The idea that quantitative easing is the only basis for a rise in the price of silver is preposterous. What about war? An open war with Iran would send gold up, and then also increase industrial and fear demand for silver. Gold could head up towards $1900 if there is a further breakup of plans for an European Stability Mechanism (ESB). That would mean a price rise for silver. Quantitative Easing alone is not the only reason to expect silver to increase in price.
The silver price tumbled 29 percent from February-June 2012, but, as Bloomberg points out, the metals volatility is “masking what are already historically high prices.” Despite that silver is trading 44 percent below its recent high of $49.85 of April 2011, the two-decade average for the devil’s metal is $9.97.
“Industrial demand may remain weak at least for another six months,” said Jochen Hitzfeld from UniCredit SpA in Munich. “This makes the gap that investors have to absorb even higher,” said Hitzfield, who forsees an average 2012 Q4 price of $28.
Investors purchased 797 tons via silver-backed ETPs this year and are now holders of 18,093 tons, if one does not want to question the solvency of COMEX.That is more than eight months of global mine output. Investors sold a net 812 tons out of ETPs last year. Total silver assets are currently 2.9 percent below the record 18,639 tons reached in April 2011, and Barclays and Morgan Stanley predict that investors will buy 500 more tons in 2013. Hedge funds are adding to their depressed silver position, too. They doubled their net-long position to 9,323 futures and options in the two weeks leading into Aug. 7, according to the CFTC, although this is still 58 percent below the five-year average, a figure which clearly signals that more shorts have accrued as the global awakening in the wake of the 2008 banker-wealth confiscation, as well as the associated fear trade, has put the spotlight on silver and precious metals.
Although silver is usually tagged as schizophrenic metal due to its dual monetary and industrial applications, it really might be the options traders who are schizo. For example, the most held contract offers the right to buy silver at $50 per ounce by November 2013, whilst the next two biggest enable holders to sell silver at $20 by November 2013 and November 2012. For a comparison, the five largest gold options are all for purchases at higher than today. Those silver positions suggest that there is a tug-of-war taking place over the silver price.
The 100-day historical volatility for futures in silver is at 30.8 percent, which is a volatility more pronounced than gold, platinum, palladium and the main industrial metals traded on the London Metal Exchange. All these dynamics with the vast majority of the retail public not taking part in this popular investment – less than 1%.
Demand for silver will continue to increase. In India, where silver
hoarding has been of concern to the silver abusers (big industry,
mostly) for over a century (at least), gold and silver demand is
expected to exceed 6000 tons annually by 2016-2017 from the current
levels of 3000 tons. By 2025, according
to the Mineral Exploration and Development Report for 12th Five Year
Plan Period by the Ministry of Mines, that number could exceed 10,000
tons.
All of this absolutely worries the powers-that-be embodied in the Silver Users Association. Already in 2006, pre-crisis, Silver Users Association was expressing concern to the CFTC regarding the new derivative products pertaining to silver. They worried a dry-up in the physical would cause them to lose control of the precious supply.

Why The Government Is Destroying The U.S. Dollar
終於找到原文 .......
http://www.marketoracle.co.uk/
Interest-Rates / US Debt Aug 14, 2012 - 11:44 AM

 The United States government has five interrelated motivations for destroying the value of the dollar:


http://www.marketoracle.co.uk/
Interest-Rates / US Debt Aug 14, 2012 - 11:44 AM
By: Dan_Amerman
The United States government has five interrelated motivations for destroying the value of the dollar:
1. Creating money out of thin air on a massive basis is all that
stands between the current state of hidden depression, and overt
depression with unemployment levels in excess of those seen in the US
Great Depression of the 1930s.
2. It is the most effective way to meet not just current crushing
debt levels, but to deal with the rapidly approaching massive
generational crisis of paying for Boomer retirement promises.
3. It creates a lucratively profitable $500 billion a year hidden tax
for the benefit of the US government which is not understood by
voters or debated in elections.
4. It is the weapon of choice being used to wage currency war and reboot US economic growth; and
5. It is an essential component of political survival and enhanced power for incumbent politicians.
In this article we will take a holistic approach to how
individual short term, medium and long term pressures all come
together to leave the government with effectively no choice but to
create a substantial rate of inflation that will steadily destroy the
value of the dollar.
If you have savings, if you rely on a pension, if you are a retiree
or Boomer with retirement accounts - any one of these five fundamental
motivations is by itself a grave peril to your future standard of
living. However, it is only when we put all five together and see how
the motivations reinforce each other, that we can understand what the
government has been and intends to continue doing, and then begin the
search for personal solutions.
Reason One: The Political Interests Of Self-Serving Politicians
As further covered herein, almost 9% of the US economy is currently
funded by deficit spending. From a political perspective, this $1.3
trillion a year is "free money" that politicians get to disburse on a
political district and favored special interest group basis. In other
words, roughly $1,000 per month, per American household can be used
to reward friends and can be withheld from enemies, with personal
credit being taken by the benevolent politicians for this never-ending
largess.
In past decades, politicians were restricted to spending perhaps $200
or $300 per month per household over and above what the government
was collecting in taxes, with the difference being borrowed in the
bond market. Anything above that would require the unpleasantness of
raising taxes, which might put individual politicians in danger of
actually losing their position and privileged lifestyle if he or she
wasn't in a "safe" district. However, in the current climate all
limitations are gone, the pork is rolling out on a historically
unprecedented basis, and the politicians are wielding unprecedented
power.
So why do the limitations usually exist on at least some level, and
why are they gone now? Historically, the US government has directly
created money out of thin air on a massive basis to fund deficit
spending during the Civil War, and also during the Revolutionary War.
There is a very good reason such governmental actions are so rare:
the value of the US dollar was rapidly destroyed in both instances.
So, this spending without limit would not ordinarily be a sensible
path. Unless, from the government's perspective, there were other
dangers that were considered a greater threat, that could be addressed
only through destroying the value of the dollar.
Reason Two: To Hide A Depression
I have written numerous articles about various aspects of Reasons
Two through Five for some years now, and my long term readers and
subscribers have been well aware of the building pressures. While the
emphasis of this article is on the interweaving of the short, medium
and long-term relationships between the five reasons, we will first
set the stage by taking a few paragraphs each to briefly review the
individual government motivation, with a link to a full length article
that covers the problem in more depth.
While you wouldn't know it from government press releases or media
headlines, there has been a gaping hole in the US economy since 2008,
as illustrated below:
During the first round of the financial crisis, the US private
economy nearly collapsed, threatening to send the US economy straight
into deep depression. We're talking about a $1.3 trillion private
sector collapse that was contained only by the government
fantastically increasing the money it spent, even while tax revenues
were falling. The creation of huge government deficits has been all
that has maintained even a facade of semi-normalcy. Remove the
mechanism of the government creating money so that it can spend what
it doesn't have, and it is straight to official Great Depression-level
unemployment in months.
Even as the true gravity of the situation is hidden from the general
public, so too is the true cost of the grossly irresponsible
short-term "band-aid" that is being used to cover the hole in the US
economy. The destruction of the value of savings in general, as well
as the impoverishment of Boomers and retirees in particular, is
explained in my article linked below, "Hiding A Depression: How The
US Government Does It."
Reason Three: A Desperate Attempt To Escape Depression By Waging Currency War
The US government has been waging currency war since September of
2010. Simply put, the US would have great difficulty emerging from
the depression described above so long as the US dollar is "strong",
because a strong dollar translates to "expensive" US workers who have
difficulty competing for market share even in the US economy, let
alone abroad. One solution is that when a nation slashes the value of
its currency, its workers become relatively cheaper, and they then
cannot only better defend their domestic market share, but can begin
to take market share in foreign economies as well. However, when a
major nation goes on the offensive, many trading partners will
counterattack and try to defend their economies, not by making their
own currencies stronger, but by making their own currencies weaker, so that their domestic workers remain relatively inexpensive and will be better able to compete for market share.
To successfully go on the currency offensive and negate attempted
counterattacks, Federal Reserve Chairman Bernanke chose a radical tool -
he publicly announced that the Fed would be directly creating money
on a massive scale equal to 9% of the US economy, with the proceeds
going to purchase US government debt in the secondary markets.
Ultimately, the only protections for a symbolic currency (such as the
US dollar) are the policies deployed by the central bank to maintain
that value. And when the nation's chief central banker directly
threatens to use his power to destroy the symbol rather than preserve
it - the threat is extraordinarily effective.
There is no free lunch, however. While the US government is
insisting to the world-at-large that it is not engaged in currency
warfare, in order to maintain the plausible deniability that is
essential to diplomatic doublespeak, it is also hiding the heavy cost
from its own citizens. The US standard of living since the late 1990s
has been based on having a "strong" dollar and huge trade deficits -
meaning we haven't actually been able to pay for what we consume for a
long time. Therefore, even as jobs and the real economy grow, there is
a drop in the overall standard of living, that is not evenly weighted
- but is disproportionately born by savers, Boomers and retirees.
Much more information on how this works and the specific ways that
older citizens will be bearing most of the pain can be found in my
article linked below, "Bullets In The Back: How Boomers &
Retirees Will Become Stimulus, Bailout & Currency War Casualties".
These second and third elements of hiding a depression and waging
currency war are tightly interwoven, and could even be called "killing
two birds with one stone". The money doesn't exist to keep the US
from openly plunging into depression, it simply isn't there for a
fiscally responsible government. And covering the economic hole by
creating money out of thin air at a rate equal to 9% of the total US
economy is so fiscally irresponsible that few nations dare a
counterattack of such magnitude. For now, massive monetary creation
allows the US to not only cover over the current hidden depression,
but also to wage all-out currency war to try to emerge from that
depression.
However, to fully understand the agenda of the US government, we have
to look at the greatest financial problem of all, and how destroying
the value of the dollar is the intended solution.
Reason Four: Dodging National Bankruptcy
Sometimes households reach the unfortunate point where when they add
up the credit cards, mortgage payments, and 2nd mortgage payments -
they realize that they will never be able to pay their bills. They
know they are bankrupt and there is no way of dodging that. But
instead of reducing their spending - they may even step up the
spending, until all the lines of credit are maxed out, and the bills
are all in arrears. Because, once you know bankruptcy is inevitable
anyway - why slash your standard of living before you absolutely have
to? Partying it up now for another few months won't change the
destination, so why not?
Fortunately, relatively few ordinary people think that way. There is
ample evidence, however, that a good number of politicians hold that
mindset when it comes to budget deficits that appear impossible to
repay, at least in the conventional manner.
There is a lie that is being frequently repeated, which is that our
children and grandchildren will be slaving away for decades to pay
back the money that we've been borrowing to fund this reckless deficit
spending. The assumption underlying the lie is that if it weren't
for the current spending, the nation would be fine, and therefore
increased taxes will be needed to pay back the borrowing.
Except that the nation isn't fine. Like most other major developed
nations in the world, the United States has been effectively bankrupt
for quite some time, with a day of reckoning that is approaching fast
with or without the current outrageous level of deficit spending.
The graph below is from my article, "Six Layers Of Deficit Impossibilities Mean Retirement Catastrophe".
http://danielamerman.com/articles/2011/LdeficitC.html
As developed step by step in "Six Layers", when we add up current and
future Federal deficits, as well as unfunded Social Security,
Medicare and other unfunded government promises, the total comes to over $785,000 per non-retired household (over the coming years) that has an above poverty line income.
And this isn't even the total cost - it is the excess cost over and
above current estimated tax receipts, which assumes a healthy and
growing economy. When we drop the assumption of an economy growing at
the same rates of the last 50 years, then the shortfall goes far
higher - perhaps over $200 trillion for Social Security and Medicare
alone by some recent estimates. That would raise the total shortfall
to over $2 million per non-retired and above-poverty-line household.
If taxes can’t pay (and it’s ludicrous to think they can), and the US doesn’t declare bankruptcy, then just how do we cover the gap?
Short answer: pay in full, but make the dollar worth five cents.
This drops the per household cost for everything from almost $800,000
down to about $40,000. Painful, but manageable over a period of 20-30
years.
Merely make a dollar worth five cents, and impossible government
promises become quite payable. The problem with this "solution" is
that it also requires making most people's life savings worth five
cents on the dollar.
Reason Five: Create A Massive Hidden Tax
The Federal Reserve effectively controls short, medium and long-term
interest rates in the United States, and this means that it controls
the borrowing costs of the United States government. As developed my
article linked below, "Hiding A $500 Billion Tax On Savings: How The
Government Deceives Millions", by forcing interest rates below the
rate of inflation, the Federal Reserve creates about a half trillion
dollar per year "windfall" gain for the Federal government.
http://danielamerman.com/articles/2011/SaveTaxC.html
This is not "free money", far from it. Every dollar of benefit for
the government from interest rate manipulations comes directly out of
the pockets of savers. That is, for the government to come out ahead
by $500 billion per year requires savers and pension funds to come up
short by $500 billion per year. This makes it a tax in all but name.
It is also essential to note that two elements have to come together
to make this hidden tax work: 1) there have to be low interest rates,
and 2) there also has to a substantive real rate of inflation (which
can be quite different from the official rate).
From a politician's perspective this massive tax - almost three times the size of federal corporate taxation
- is a "dream tax". Half a trillion dollars a year is available to
spend without raising taxes or increasing deficits. Sure, there is a
cost, which is the entirely deliberate destruction of retirement
dreams and promises for tens of millions of US workers and retirees -
particularly Boomers - as well as pushing forward the insolvency of
state and local government pension funds around the country. But the
deliberate bankrupting of a generation is a long term problem with no
clear accountability and almost no voter understanding, which means it
is more or less irrelevant for how political decisions are made
today.
Look For The Silver Lining: Silver Swan Ready For Takeoff
http://goldstocktrades.com/
An old melody advises us to look for the silver lining whenever dark clouds appear in the blue. There is economic and political upheaval all over the world, especially in the South China Seas. This may directly affect the world’s supply of industrial metals such as graphite, rare earths, molybdenum and tungsten.
Today we direct our attention to an area where silver is shining. Poor man’s gold may come into prominence shortly and provide our subscribers with possible profits.
The silver battlefield is filled with bulls and bears fighting for dominance. Recently, the poor man’s gold has dropped to the $26 area. The struggle continues between the opposing sides. The bulls and bears are keeping their eye on this critical support level at 2011 lows.
We sense that the bulls will prevail at this mark. The reasons to buy silver now is compelling. The U.S. dollar may have already reached an interim top as investors realize that the employment situation in the U.S. is still a concern and that the Federal Reserve will need to implement some form of QE3 to devalue the dollar to pay off soaring deficits and promote inflation possibly announced at the end of this month in Jackson Hole.
The bears disagree and claim that silver will be pushed back beneath this level as silver plunges to new lows as the Fed continues to keep its trigger off of the QE3 bazooka and wait until after the election. Silver is holding the line making a rounded bottom. Notice the rounding bottom signaling a potential breakout as sellers become exhausted.

On the supply side, silver production comes mainly from Peru and Mexico where miners are facing significant challenges including violence. Newmont is having to deal with violent protests in Peru which reminds us of what Fortuna Silver had to deal with in Mexico. Right now, Pan American Silver is suspending investment in its flagship Navidad Project due to the rising resource nationalism in Argentina. Pan American paid $500 million for the asset in 2009. This project may be the richest undeveloped silver deposit in the world.
Similarly, Bolivia and Evo Morales is considering nationalizing South American Silver’s(SAC.TO) large undeveloped silver project amidst violent indigenous protests. The company describes it as “one of the world’s largest undeveloped silver deposits.” The company is planning to invest over $50 million into the project. At the same time the Bolivian peasants have violently kidnapped five workers from the project.
Such turmoil in Peru, Mexico, Argentina and Bolivia may add to the world’s already existing shortage of silver. This supply crunch is combined with rising political uncertainty in Egypt, Syria and Iran and economic malaise in the EU and the United States which is causing investment demand for silver to rise exponentially.
All signs are pointing to a possible global inflation which could propel silver prices higher. We have record deficits in the U.S. where many citizens are looking to protect their savings from a potential devaluation to pay down record debts. With the recent Obamacare Supreme Court Ruling entitlement spending will soar.
Former Federal Reserve Chairman, Alan Greenspan noted in 2010 that “Only politically toxic cuts or rationing of medical care, a marked rise in the eligible age for health and retirement benefits…or significant inflation… can close the deficit.”
Remember, in response to Keynesian pump-priming inflation threatens to make silver increasingly attractive as a safe haven. There is always the presence of increased industrial demand for the poor man’s gold. Silver is being used increasingly in high tech applications from batteries to solar panels.
Last month the silver etf’s added 293 metric tons of this valuable metal to their holdings which represents their highest inflows since September. The bears claim that silver’s proximity to the $26 line is a negative signal and are pushing below their 50 and 200 day moving averages on the way to $18.
Recall that silver is volatile and moves up or down more than other commodities such as gold. On the other hand, QE3 if it is implemented will encourage monetary easing internationally and thus will boost silver prices.
After QE2 we called the silver breakout to the day on 8-25-10.
Silver soared from $18 to close to $50 outpacing other commodities. If QE3 is carried out, silver could experience a similar type of move. In such an event, the specter of inflation may trigger silver’s rapid ascent into new all time highs. We regard silver as a long term holding which may be ready to move into new all time highs past $50 depending in part on the Fed’s next move.
An old melody advises us to look for the silver lining whenever dark clouds appear in the blue. There is economic and political upheaval all over the world, especially in the South China Seas. This may directly affect the world’s supply of industrial metals such as graphite, rare earths, molybdenum and tungsten.
Today we direct our attention to an area where silver is shining. Poor man’s gold may come into prominence shortly and provide our subscribers with possible profits.
The silver battlefield is filled with bulls and bears fighting for dominance. Recently, the poor man’s gold has dropped to the $26 area. The struggle continues between the opposing sides. The bulls and bears are keeping their eye on this critical support level at 2011 lows.
We sense that the bulls will prevail at this mark. The reasons to buy silver now is compelling. The U.S. dollar may have already reached an interim top as investors realize that the employment situation in the U.S. is still a concern and that the Federal Reserve will need to implement some form of QE3 to devalue the dollar to pay off soaring deficits and promote inflation possibly announced at the end of this month in Jackson Hole.
The bears disagree and claim that silver will be pushed back beneath this level as silver plunges to new lows as the Fed continues to keep its trigger off of the QE3 bazooka and wait until after the election. Silver is holding the line making a rounded bottom. Notice the rounding bottom signaling a potential breakout as sellers become exhausted.
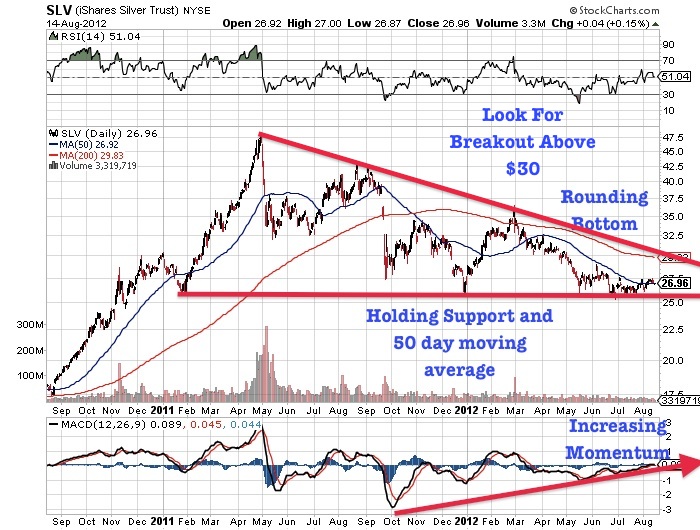
On the supply side, silver production comes mainly from Peru and Mexico where miners are facing significant challenges including violence. Newmont is having to deal with violent protests in Peru which reminds us of what Fortuna Silver had to deal with in Mexico. Right now, Pan American Silver is suspending investment in its flagship Navidad Project due to the rising resource nationalism in Argentina. Pan American paid $500 million for the asset in 2009. This project may be the richest undeveloped silver deposit in the world.
Similarly, Bolivia and Evo Morales is considering nationalizing South American Silver’s(SAC.TO) large undeveloped silver project amidst violent indigenous protests. The company describes it as “one of the world’s largest undeveloped silver deposits.” The company is planning to invest over $50 million into the project. At the same time the Bolivian peasants have violently kidnapped five workers from the project.
Such turmoil in Peru, Mexico, Argentina and Bolivia may add to the world’s already existing shortage of silver. This supply crunch is combined with rising political uncertainty in Egypt, Syria and Iran and economic malaise in the EU and the United States which is causing investment demand for silver to rise exponentially.
All signs are pointing to a possible global inflation which could propel silver prices higher. We have record deficits in the U.S. where many citizens are looking to protect their savings from a potential devaluation to pay down record debts. With the recent Obamacare Supreme Court Ruling entitlement spending will soar.
Former Federal Reserve Chairman, Alan Greenspan noted in 2010 that “Only politically toxic cuts or rationing of medical care, a marked rise in the eligible age for health and retirement benefits…or significant inflation… can close the deficit.”
Remember, in response to Keynesian pump-priming inflation threatens to make silver increasingly attractive as a safe haven. There is always the presence of increased industrial demand for the poor man’s gold. Silver is being used increasingly in high tech applications from batteries to solar panels.
Last month the silver etf’s added 293 metric tons of this valuable metal to their holdings which represents their highest inflows since September. The bears claim that silver’s proximity to the $26 line is a negative signal and are pushing below their 50 and 200 day moving averages on the way to $18.
Recall that silver is volatile and moves up or down more than other commodities such as gold. On the other hand, QE3 if it is implemented will encourage monetary easing internationally and thus will boost silver prices.
After QE2 we called the silver breakout to the day on 8-25-10.
Silver soared from $18 to close to $50 outpacing other commodities. If QE3 is carried out, silver could experience a similar type of move. In such an event, the specter of inflation may trigger silver’s rapid ascent into new all time highs. We regard silver as a long term holding which may be ready to move into new all time highs past $50 depending in part on the Fed’s next move.
Silver follows Gold and responds similarly
The greatest approach to investing in silver is looking at the long term outlook and remaining patient.
 LOS ANGELES(BullionStreet): At the
moment,Silver is attracting first time investors and causing long term
investors to beef up their holdings, according to Stephen M Smith,
managing member of Smith McKenna LLC.
LOS ANGELES(BullionStreet): At the
moment,Silver is attracting first time investors and causing long term
investors to beef up their holdings, according to Stephen M Smith,
managing member of Smith McKenna LLC.
Smith said the white metal has been relatively stable at a price that many would consider cheap and most people miss out on investing in silver and the potential wealth creation opportunities because of uncertainty and lack of information.
It's the perfect time to learn about a silver investment because historically, silver is exceptionally cheap right now," he added.
Last week however, silver edged into the $28/ounce territory showing signs that it likely won't remain at this cheap price for very long.
Analysts are firmly set on silver being due for a strong rebound, especially with the recent surge of increased investor interest.
Those who have been considering whether or not to invest in silver, should be getting all the information they can and buying right now; ahead of the next boom.
The greatest approach to investing in silver is looking at the long term outlook and remaining patient.
Historically, silver follows a common path and responds similarly to its costlier friend gold.
With the potential for increased inflation through stimulus efforts in the U.S. And Europe, along with positive global manufacturing outlook data; silver could soar virtually overnight.
Precious metals should be a part of any investment portfolio as a means of diversification. According to Smith, "Silver could perform stronger and be a better investment vehicle than your IRA/401k."
Precious metals are expected to remain strong, especially silver over the next few years. Because of projected interest rates, the stock and bond bubble, and global economic recovery; silver could see a spot price as high as$100an ounce or more in the near future.
Silver, gold and other precious metals will always be worth more than paper commodities because they are a physical asset and finite in supply.
Mined silver has increased very little in 2011 at roughly 1.4% and is expected to be very similar in 2012 as well. As other investment and monetary forms depreciate, precious metals thrive, especially with limited supply.
Analysts at HSBC said, "We retain our bullish view on gold for the second half of 2012. We expect prices to rally to above $1,900/oz by the end of the year."Silver will likely follow suit, and could surge to $50/oz.
Smith said the white metal has been relatively stable at a price that many would consider cheap and most people miss out on investing in silver and the potential wealth creation opportunities because of uncertainty and lack of information.
It's the perfect time to learn about a silver investment because historically, silver is exceptionally cheap right now," he added.
Last week however, silver edged into the $28/ounce territory showing signs that it likely won't remain at this cheap price for very long.
Analysts are firmly set on silver being due for a strong rebound, especially with the recent surge of increased investor interest.
Those who have been considering whether or not to invest in silver, should be getting all the information they can and buying right now; ahead of the next boom.
The greatest approach to investing in silver is looking at the long term outlook and remaining patient.
Historically, silver follows a common path and responds similarly to its costlier friend gold.
With the potential for increased inflation through stimulus efforts in the U.S. And Europe, along with positive global manufacturing outlook data; silver could soar virtually overnight.
Precious metals should be a part of any investment portfolio as a means of diversification. According to Smith, "Silver could perform stronger and be a better investment vehicle than your IRA/401k."
Precious metals are expected to remain strong, especially silver over the next few years. Because of projected interest rates, the stock and bond bubble, and global economic recovery; silver could see a spot price as high as$100an ounce or more in the near future.
Silver, gold and other precious metals will always be worth more than paper commodities because they are a physical asset and finite in supply.
Mined silver has increased very little in 2011 at roughly 1.4% and is expected to be very similar in 2012 as well. As other investment and monetary forms depreciate, precious metals thrive, especially with limited supply.
Analysts at HSBC said, "We retain our bullish view on gold for the second half of 2012. We expect prices to rally to above $1,900/oz by the end of the year."Silver will likely follow suit, and could surge to $50/oz.
訂閱:
文章 (Atom)