2015年6月10日星期三
天狼星SIRIUS
我們在地球上—並不 孤單
先進的星際文明已經拜訪地球,它們以超越光速之速穿梭各緯度。外星文明帶來的新興能源能讓地球人類走進一個新時代。但是,執政政府們為了繼續享有控制,一直壓制著這些資訊的傳播。現在到了你要知道這一切的時候了……以下內容將告訴你真相。
你將看到什麼?
斯蒂文.格瑞爾博士是全球大揭露運動和外星智慧研究中心的創辦人。目前,他正和艾美獎得主阿馬迪普·卡萊卡導演及他的團隊合作籌劃一部大揭露的重要電影。
這部電影揭露不為人知的驚人內幕:外星人已經拜訪地球,他們不是懷著惡意來到地球,而是為了人類的未來。
一群掌握軍事、工業和經濟命脈的利益集團一直和他們保持著聯繫,我們瞭解到這個秘密被隱藏了60多年。隱藏這些秘密是為了不讓世界從 石油、天然氣、煤炭和核能中獲得解放,不讓新能源時代取代當前的世界秩序,不讓人民獲得真正自由。
電影的組成部分
這部電影的第一部分將和你分享外星人存在的證據。這些證據來自官方文件,來自高水準的目擊人證詞。大揭露運動和外星智慧研究中心擁有積累20多年、不外傳的影片膠卷。
電影的第二部分採訪了很多長期從事揭露秘密技術的傑出科學家們。他們告訴我們怎樣從周圍環繞的空間組織中獲得能源,揭露工業巨頭怎樣壓制這些信息。尼古拉·特 斯拉知道什麼呢?為何在他臨死前,聯邦調查局不讓他論文內容外洩呢?人造反重力車輛已經使用了近半個多世紀;為控制人類,有些甚至被用於製造綁架外星人的 騙局。現在到了讓人們瞭解和發展新能源的時候了,可以把這些科技用在帶來和平的能源中。電影的第三部分,即最後一部分,探討了怎樣接觸外星球:CE-5原則及如何與多維宇宙搭建一座橋樑。我們也瞭解到普通人如何與外星人接觸。只是一念而已。
我們需要你們的幫助
沒有一家主流媒體集團和機構希望我們發布這些資訊。所以需要您的幫助和支持。
我們打算製作這部影片,不僅投資拍攝它,而且要在各地上映。所有人和這部電影的成功密切相關。 70多億人口即將用完地球資源,這是我們要做出改變的時候了。
影片連結__http://www.56.com
金銀市勢進一步轉弱
初夏6月的第一周,金市繼續從3週前反彈高位每盎斯1232美元向下回跌,到上週末最低曾見1171.8美元,為今年3月中旬以來的最低水平。其後收報1172.3美元,比前週跌去17.7美元,同時意味著本年至今金價出現0.9%的虧損。
銀市亦繼續從3週前反彈高位每盎斯17.77美元滑跌,上週末曾低見15.93美元,為上月初以來的最低水平。其後收報16.125美元,比前週跌了0.575美元,但本年至今銀價仍有2.8%的進賬。
財經新聞說,上週末金價下跌主要是受美元上升所拖累,此語是事實,但不是事情的全部。 4月間,金價與美元曾出現兩者同向現象,到5月始回復大致反向行情。至6月初兩者又出現短暫同向,直至上週末段才再回复互為反向的市況。
債市影響金價更大
另 一方面,近半年多來,金價與美國10年債券價格一直維持著頗密切的同向與同步關係。早前數天,10年債價從最近反彈高位急促回落,金價雖亦跌,但跌幅不及 前者。到最近三天,金價似乎追趕債價的跌幅。由此可見,中短期而言,美國債市的表現對金市的影響比美元匯價的影響更大。
以上行情告訴我們,目前金市走勢主要不是反映美元匯價的強弱,而是較集中反映美國聯儲局實施的貨幣政策正常化方面和市場對此的預期。
美 國10年期債券價格其實在今年1月底已從高位反復回落,到5月雖出現一個頗出人意表的較大反彈,惟踏入6月又急促回落。至上週末更創出今年以來的最低位, 返回到去年10月時的水平。相應地,10年期債券孳息率自今年2月從1.68厘(收市價)的低谷往上爬升,5月份曾出現若干反复,但到上週末高收報 2.41厘,高於去年11月最高收市水平。
美國債券孳息率反復回升,正反映聯儲局貨幣政策正常化的進程不可迴避。上週末公佈的美國非農業新職位增加28萬份,遠好過市場預期,更被視為稍後在9月份很可能加息。
然而,問題不在利率高低本身,更重要的是目前市場趨向,正表示實質利率已從低水平回升,此不利於金價。過往金價高漲,很大程度是由負的實質利率所造成。
兩項指數早有啟示
其實金甲蟲指數HUI的表現對金市復弱早有一定啟示。該指數在上月中旬已跌破自3月以來的上升軌,本月初雖有反彈,惟無法返至此上軌的下沿,近數天急回跌,到上週末回復到3月時的偏低水平。
商品市場亦有類似的啟示,CRB商品期貨指數亦在5月中旬跌破自3月以來的上升軌,上月下旬雖有反彈,惟本月又回跌。儘管目前在上月低位水平尚有爭持,但調整勢持續。
金 價本身在上周亦跌破自3月以來的上升軌,上月低點1168美元且一度失守,市勢進一步轉弱。現時在1186美元水平已成為回升阻力,諒難重越1190美元 至1193美元(即一季平均線水平)。目前金市最接近的支持位在1159美元;而1149美元是一個關鍵位,此位若不支,今年低點1141.6美元有跌破 的危險。
上周銀市牛熊兩大陣營的淨倉量雖略回降,但仍處頗高水平,即是說倉位結構依然脆弱。銀價現跌破4月以來的升軌,3月以來的升軌 水平15.9美元面臨著考驗。預料銀價在16.4美元及16.55美元會有回升阻力,諒難重越16.9美元水平。而15.6美元應是關鍵位,此位若不支, 今年低點15.26美元恐有危險。
本周金銀兩市或續受希臘消息的若干支持,但市場焦點很快會轉到月中聯儲局議息會議方面。
2015年6月9日星期二
MUST SEE CHART: Major Bank Fraud Adds Up To A Lot Of Silver
The amount of fraud taking place in the major banks throughout the world is staggering to say the least. Ironically, the only market that isn’t manipulated, is the silver market… so they say. To make it seem as if the regulators are on the ball, many of the major banks have been found guilty of committing one fraud or another, paying large fines and settlements.
The most recent settlement by the criminal bankers was a cool $5.6 billion for rigging the foreign currency markets for their own financial benefit. The banks responsible for this sort of illicit behavior comes from the list of typical seedy characters; Citigroup, JP Morgan, Barclays, RBS and UBS. You can read all about it in the Wall Street Journal article.
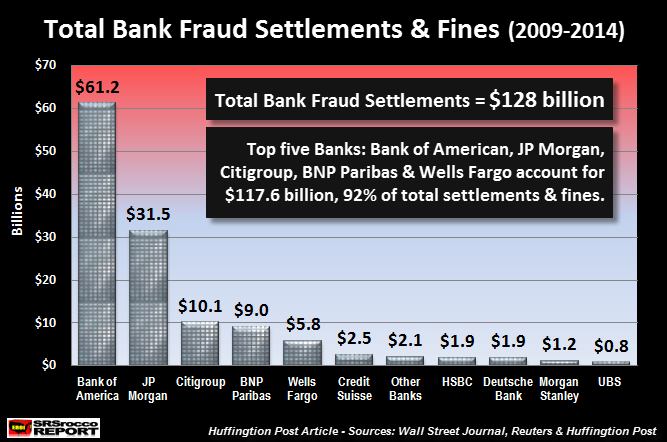
Even though $5.6 billion is a hefty figure, when we add up the total fines and settlements paid by the Banking Industry since 2009… it’s a serious amount of fiat currency. How Much? Well, if we look at the chart below, it should offer a pretty good picture:
According to a recent article by the Huffingtion Post, the major U.S. and European Banks have paid at least $128 billion in fines and settlements to regulators since 2009. As we can see, Bank of America gets the first place prize for paying a staggering $61.2 billion in fines, while JP Morgan ranks second at $31.5 billion and Citigroup taking a comfortable third, forking over $10.1 billion.
Scanning across the rest of the chart, we can see the additional fine upstanding banks that participated in criminal activity and their subsequent fines. Of course, Americans like to brag that the United States is best country in the world to live, so it’s comforting to know that four of the five top corrupt banks (in amount of fines and settlements) in the world are located in the good ole US of A.
The top five banks accounted for 92% ($117.6 billion) of the total $128 billion in fines. However, the U.S. Banks representing wholesome American icons such as baseball, hotdogs, apple pie and Chevrolet coughed up $108.6 billion of that amount. It’s certainly reassuring to see our financial institutions working hard to rank first in the world as it pertains to illegal and criminal financial activity.
Major Bank Fraud Adds Up To A Lot Of Silver
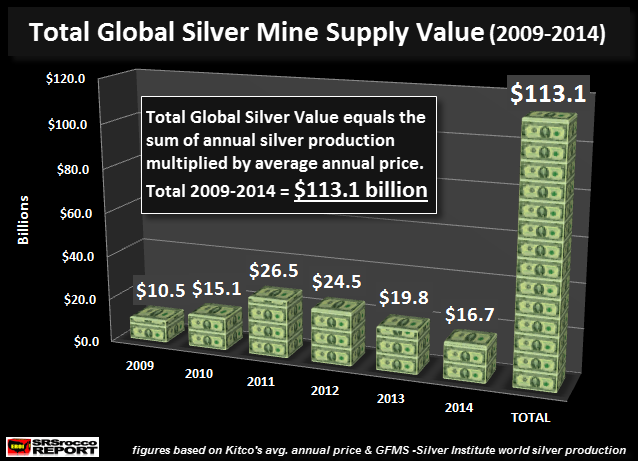
If we consider just how much the U.S. and European banks have paid in fines and settlements since 2009, turns out it could have purchased one hell of a lot of silver. In order to get an idea of the total value of global silver mine supply since 2009, I put together the following chart:
Each year in the chart represents the value of world silver mine supply calculated by multiplying total global production by the average annual price. These figures were based on price information taken from Kitco.com and global silver production figures from the Silver Institute-Thomson Reuters GFMS.
For example, this is the total value of world silver mine supply in 2014:
2014 World Silver Mine Supply Value = 877 million oz X $19.08 = $16.7 billion
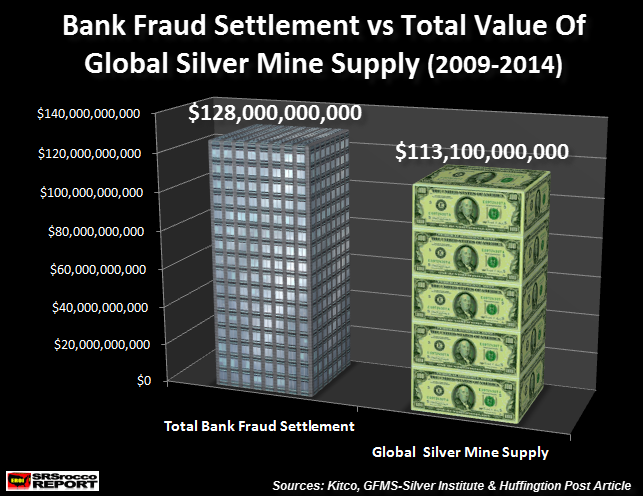
If we add up the figures for each year in the chart, the total value of global silver mine supply was $113.1 billion. Well, that seems like a lot of money until you compare it to the fines and settlements paid by the major U.S. and European banking institutions:
Amazingly, the major banks paid more in fines than the cumulative value of all silver mined since 2009. Just think about that for a minute. The amount of fraud and criminal activity at these major banks forced them to pay fines greater than the value of world silver mine supply. Of course, the $128 billion in fines they paid is a great deal less than the profits they made.
According to the Huffingtion post article:
Since 2009, the American banking industry alone has racked up nearly $503 billion in profits, according to FDIC quarterly data through the first quarter of 2014.
These fines have made occasional dents in some quarterly earnings, but they’re effectively drops in the banks’ buckets compared to their greater profits.
If the bank fines are “drops in the bank’s buckets”, then it’s good for business for these institutions to continue rigging, raping, manipulating and controlling the economic and financial system. Thus, anyone at this time who still believes the gold and silver markets aren’t manipulated, needs to check oneself into a local health clinic and receive a Cat-Scan of the brain.
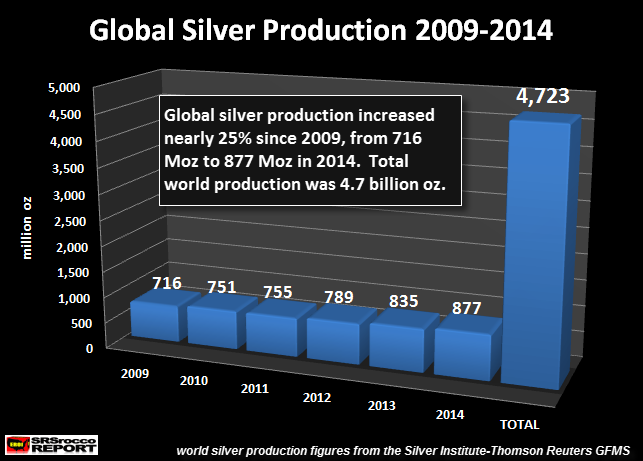
So, how much silver could have been purchased with the fines and settlements paid by the major banks? The chart below provides the answer:
The paltry $128 billion of fines paid out by the major U.S. and European banks could have purchased all the 4.7 billion ounces of silver produced by the world since 2009. However, this silver production only amounted to $113.1 billion (estimated) and if we add the remaining $15 billion left over… that’s at least another 800 million oz. at the current price. Which means, bank fraud settlements could have purchased at least 5.5 billion oz of silver, including the majority of global production in 2015.
We must remember, gold and silver are supposed to act as barometers against the U.S. Dollar and other assorted fiat currencies. If the major banks can pay $128 billion in fines (that we know about) over the past six years, how can this not impact the value of the precious metals?
Currently, it pays the banks to conduct fraudulent, criminal and illicit behavior. If the U.S. Banks forked out $110 billion in fines since 2009 while their total profits exceeded $503 billion, that’s a pretty good racket. Fortunately for the precious metal investors, all Ponzi Schemes come to an end. While this one has gone on longer than we thought, the end may arrive sooner than we expect.
各國央行正在失去對金融市場的控制
2015年6月6日星期六
Gold Prices Can Go One Of Two Ways – Either Way, You Can Profit
Janet Yellen, chair of the Federal Reserve Board, gave an important speech in Providence, Rhode Island, on Friday, May 22. The speech was widely followed by the press and pundits.
News outlets pounced on her statement that “I think it will be appropriate at some point this year to take the initial step to raise the federal funds rate.”
Headline writers warned that the Fed was about to raise interest rates. Markets immediately reacted, sending the dollar up and stocks down on fears of higher rates.
There was only one problem with the reporting, the analysis and the market’s knee-jerk reaction. Reporters left out the biggest little word in the English language — “if.”
Those who took the time to read the actual speech instead of relying on reporters saw that Yellen’s headline quote started with the phrase, “if the economy continues to improve as I expect…”
In other words, Yellen’s prediction of a rate increase is conditional on her forecasting ability. The truth is that no major institution has a worse forecasting record than the Federal Reserve.
Yellen was candid about her abysmal forecasting record. Elsewhere in her speech, she said, “I can assure you that any specific projection I write down will turn out to be wrong.” So we can give the Fed chair credit for honesty about her forecasting, even if reporters were cherry-picking her speech to give investors the wrong impression.
What Yellen was really saying is what she has said all along. The Fed is “data dependent.” If the data come in strong, the Fed will raise rates. If the data remain weak, the Fed will not raise rates. So what do the data tell us?
Yellen expects the data on growth, inflation and job creation to strengthen, which is why she sounded her warning. But a look at actual data shows that GDP growth will be close to zero for the first half of 2015, job creation has slowed significantly since last November, real wages are flat and inflation has been below the Fed’s target for three years.
Growth in China is slowing dramatically, and what little growth Europe has shown has come entirely from the currency wars, including negative interest rates, quantitative easing and a cheap euro.
There is nothing on the horizon to change any of this. U.S. growth may struggle back to the same 2% level is has displayed since 2009, and some job growth will continue. But these developments are nowhere near what Yellen said she needs to see before raising rates. In short, expect more of the same weak growth and zero rate policy we’ve seen for the last seven years.
If Yellen’s warning and the market reaction were false alarms, what can investors expect for interest rates in the months ahead? And what are the implications of that rate forecast for various asset classes, especially gold?
As readers of Currency Wars Alert know, we use the IMPACT system based on inverse probability informed by “indications and warnings” to estimate market developments. You can think of this as reading road signs to figure out where you’re heading, even though the destination is not in sight.
The road signs can validate your path or alert you if you’re heading in the wrong direction. The important thing is to have a mental map of the area and pay attention to the signs.
One fascinating indicator of the past seven years is the direction of interest rates during periods of quantitative easing. The Fed has conducted three programs of quantitative easing since 2008, known as QE1, QE2 and QE3.
The stated purpose of each QE program is to lower interest rates, especially on intermediate-term securities. The idea is to make the yield so low that investors channel funds into other asset classes, such as stocks and real estate.
The higher prices on stocks and real estate are supposed to create a “wealth effect” that causes people to spend more. More spending will then result in higher money velocity and higher nominal GDP. Everything about this theory is flawed, but the Fed believes it, so we need to pay attention if we want to understand Fed policy.
The chart below shows the path of interest rates on 10-year Treasury notes over the past seven years. The shaded areas are the periods of quantitative easing. The red arrows show what happened to 10-year note yields during the QE periods.
Incredibly, note yields did not decline during QE. They rose all three times!There was some volatility along the way, and there were short periods when rates did decline, but the overall impact of QE was to increase rates, not decrease them.
The shaded areas in this chart are periods of quantitative easing, or “QE,” by the Fed. The red arrows show that interest rates on 10-year Treasury notes actually rose during periods of Fed easing.
Equally important for present purposes is that rates declined when the Fed was not doing QE. This is also apparent from a glance at the chart.
Why do rates rise when the Fed is easing and fall when the Fed is not easing? The answer has to do with investor expectations. The Fed may believe the economy is getting stronger, but investors and everyday Americans know better — the fundamentals are weak and getting weaker.
When the Fed prints money (that’s what QE is), investors expect inflation, and therefore rates rise. When the Fed stops printing money, investors expect deflation, and therefore rates fall.
For decades, the mantra on Wall Street has been “Don’t fight the Fed.” That was good advice in the past. But manipulation has gone on for so long and the Fed models are so muddled that a new mantra might be in order — Fade the Fed.
When the Fed is talking strong growth and rate hikes, it’s a good idea to expect the opposite.
The Fed ended QE3 last November. Not surprisingly, job growth and GDP growth rolled over around the same time, and the data have been getting weaker ever since. Interest rates have trended downward since then, despite a recent backup.
The “May Massacre” in bond prices should be seen as a technical cascade triggered by a Bill Gross blog, which resulted in position squaring by hedge funds with leveraged long Treasury positions in an overcrowded trade. The stop loss algos kicked in, and the cascade fed on itself.
Nothing fundamentally changed in May. The secular downtrend in rates, which has persisted since 1981 and accelerated since 2007, is still intact. The end of QE3, combined with tough talk from the Fed, will weaken the economy further and result in lower inflation expectations and reduced yields in the months ahead.
It is difficult to see how the Fed can raise rates in 2015 without sinking markets and the economy completely; therefore, a rate increase should not be expected. The only things that will change this outlook are if the Fed blinks and admits it cannot raise rates or if it starts to talk about QE4. We’ll be watching closely for indications and warnings on both of those events.
How can investors benefit from the huge gap between what the Fed expects and what markets expect? This is a good time to take another look at gold, especially high-quality gold mining stocks.
Gold has two ways to win. If low rates persist, gold becomes more attractive because costs of carry and opportunity costs of holding an asset without yield decline. Conversely, if rates go up, that means inflation is on the way, and the gold price benefits from that also.
Gold mining stocks have been beaten down to the point where stock prices will either go up or the miner will go out of business. That’s why it’s important to stick to the high-quality names in the major indexes.
All the best,
Jim Rickards
for The Daily Reckoning
2015年6月5日星期五
債市扭曲 後遺漸現
王冠一
2015-06-04
歐美債券沽售潮延伸至亞洲,令環球債息升至今年高位。資料顯示,環球主權債平均息率已升至 1.34 厘,相當於去年 12 月底高位。其中,澳洲十年期債息錄得三星期以來最大升幅,同期日本國債息率亦連升三日,至於新西蘭同年期債息亦升至 3.73 厘。
各地經濟數據好轉,歐元區 CPI 六個月來首度回復正數,引發投資者預期通脹升溫。德國最新亦宣布,計劃首次發行30年期通脹掛鈎債券,最終發債規模至少 100 億歐元,難道通脹真是遙遙無期?
另外,全球各地種種因素,皆誘導資金持續流出避險資產:希臘債權人努力避免希臘違約,降低了市場避險需求;美國工業及建築開支數據上升,增加今年內加息機會;日本首季經濟擴張速度為一年來最快,並連續第二季擴張;澳洲首季經濟增長按季增長 0.9% 等。
不過,債息上升並非投資市場的最大隱憂,債市更趨波動才是重點。
雖然聯儲局已經停止量寬,但手上仍持有近破紀錄規模的債券。而且目前歐洲、日本央行仍繼續每月努力於市場上買債救經濟;其中,歐洲央行更可能會在短期內加快買債步伐。
央 行已是債市最大買家,如今還要繼續大量買債,本身已經削弱債券的吸引力;加上監管機構又要求市場參與者減少高風險交易活動及降低高風險資產持有比例,都令 債市流動性大大降低。情況有如某隻股票出現貨源歸邊後,一石能夠激起千重浪,類似情況在債市發生,債息就會變得更波動。
由於債市結構被扭曲,流動性不足,每個價位涉及的買賣宗數都較以往減少,令資產價格面對突發消息、或新公布數據時變得更為敏感。萬一出現大量沽盤時,市場缺乏承接,就容易出現「人踩人」場面。
目前債息低企,十年期德國債息仍貼近零水平;假如通縮危機不再,加上股市暢旺,市場又豈能容忍低回報的債券呢?因此,債市沽售潮看似還沒完結。而投資者則需要有心理準備,債市波動性可能會愈來愈大,如此將會令股市走勢也變得難以捉摸。
股 債環環相扣,以往股市或債市出現波動,另一個市場都有大風浪。不過今年以來,債市愈來愈波動,但股市反而愈趨平靜。以美股為例,近期相對於環球多個主要市 場,顯得異常平靜。標普五百指數過去兩個月上下波幅只有 4.2%,乃 2006 年以來最小。這是暴風雨前的平靜,抑或是十年難得一遇的光景呢?
2015年6月4日星期四
One of World’s Largest Primary Silver Miners Blasts CFTC on Silver Manipulation
In an open letter to CFTC Chairman Timothy Massad, the CEO blasted the CFTC:
“Something is wrong with the price discovery process, since real producers and consumers of silver don’t appear to be represented…”
Neumeyer’s full letter to CFTC Chairman Timothy Massad (Yes, Gary Gensler is assisting Goldman in other ways now) is below:
http://www.silverdoctors.com/