https://youtu.be/osJbyOHSRgk?si=2sYqR1rnkAII5VZF

This article is an analysis of how the Chinese central bank (PBoC) buys gold in London from Western bullion banks. Because the bullion banks take care of the gold transport for the PBoC, the shipments from London to Beijing are disclosed in UK customs data. The customs data reveals that the PBoC continued to buy gold in May—when it communicated to the market it discontinued buying—at a rate of 53 tonnes. The PBoC stated it stopped buying to dampen the gold price so it could acquire more gold.
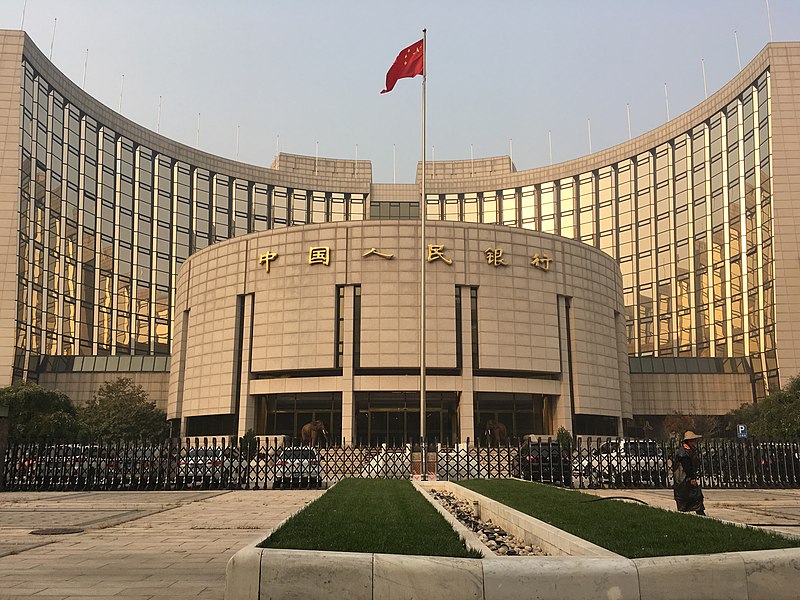
People's Bank of China headquarters in Beijing.
Several months ago, I discovered that supply in the Chinese gold market was outstripping demand. During my investigation of this anomaly, I found circumstantial evidence that led me to conclude the surplus is imported in 400-ounce bars from the United Kingdom, and surreptitiously procured by the PBoC.
Let’s go through some of the mechanics of the global gold market before we can stitch it all together.
In global customs data—officially called International Merchandise Trade Statistics (IMTS)—all gold disclosed is “non-monetary,” meaning not owned by a monetary authority such as a central bank. In the United Nations IMTS rulebook it reads that customs data excludes monetary gold:
Since monetary gold is treated as a financial asset rather than a good, transactions pertaining to it should be excluded from international merchandise trade statistics.
Though, someone familiar with the matter but who prefers to stay anonymous, shared with me that gold import and export data can relate to monetary gold. Commonly, central banks will buy gold from Western bullion banks that arrange transportation and insurance of the metal. The moment these banks ship the gold from the UK it is thus non-monetary bullion, but when it arrives in China it is monetized (changes ownership) and brought to vaults of the central bank, supposedly in Beijing.
Exports from the UK are mainly from the wholesale gold market in London where virtually all bars traded weigh 400 ounces. The retail market in Britain dealing in smaller bars pales in comparison, and the refining industry in the UK is relatively small.
In turn, at the core of the Chinese domestic gold market, which excludes Free Trade Zones (FTZs), is the Shanghai Gold Exchange (SGE) where predominantly 1Kg gold bars are traded.
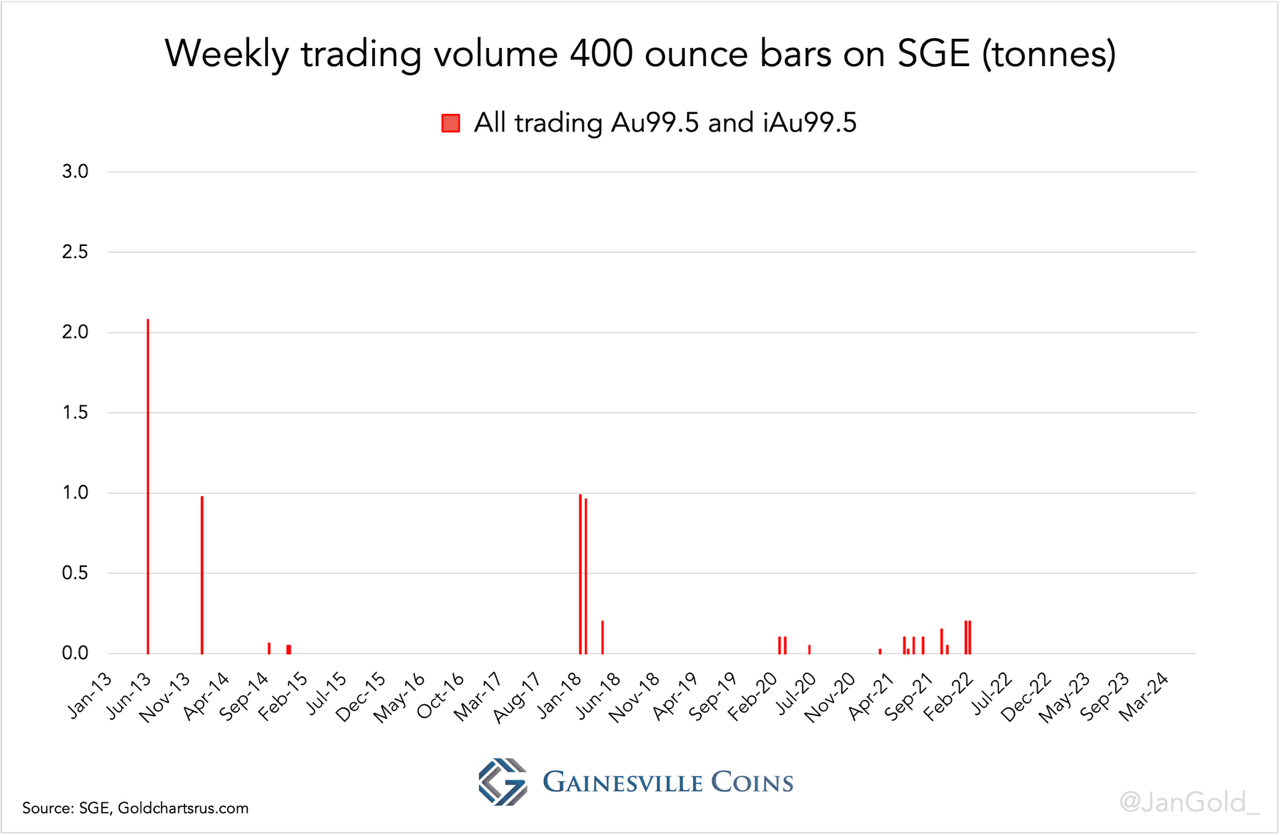
Chart 1. In the entire history of the SGE large 400-ounce bars have hardly ever traded. The most traded product on the SGE is the 1Kg 99.99 fine physical contract.
The private sector in China trades 1Kg bars through SGE, while the central bank buys “large bars” (400-ounce bars) abroad. As all gold on the SGE is traded in yuan, the PBoC can only diversify its international reserves by buying gold overseas with dollars or other foreign exchange. Aside from logic, there are multiple sources that have made clear the PBoC doesn’t purchase gold on the SGE. For example, the World Gold Council (WGC, page 9), the SGE (page 4), and it was confirmed to me personally by an ex-gold trader from a Chinese state-owned bank.
The SGE captures the lion share of all gold trading in the Chinese private market. There are rules and incentives that steer most supply—imports, domestic mine production, and recycled metal—towards the SGE, which for liquidity reasons attracts most demand. Hence, the gold withdrawn from the SGE vaults is often used as a proxy for Chinese wholesale demand. In a formula:
SGE withdrawals = net import + domestic mine output + recycled metal
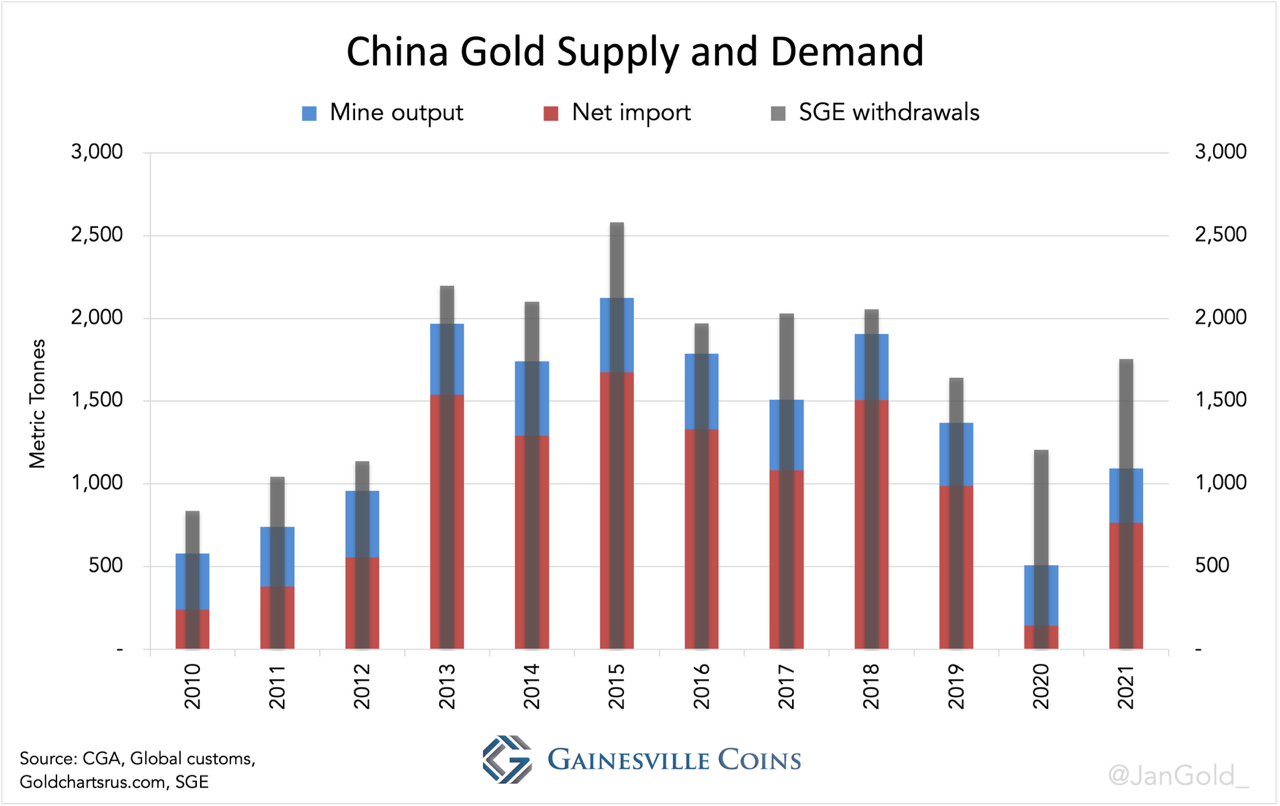
Chart 2. Apparent Chinese gold supply and demand.
Before 2022, gold supply and demand in the Chinese market matched. SGE withdrawals were always higher, to varying degrees, than net import plus domestic mine output, the difference being gold recycled through the central bourse.
If it were true that bullion banks ship gold to China, as non-monetary gold visible in customs data, that doesn’t flow into the SGE system, we would see a discrepancy between apparent Chinese gold supply and SGE withdrawals. As more gold would be supplied to China than sold through the SGE. In a formula:
SGE withdrawals < net import + domestic mine output + recycled metal
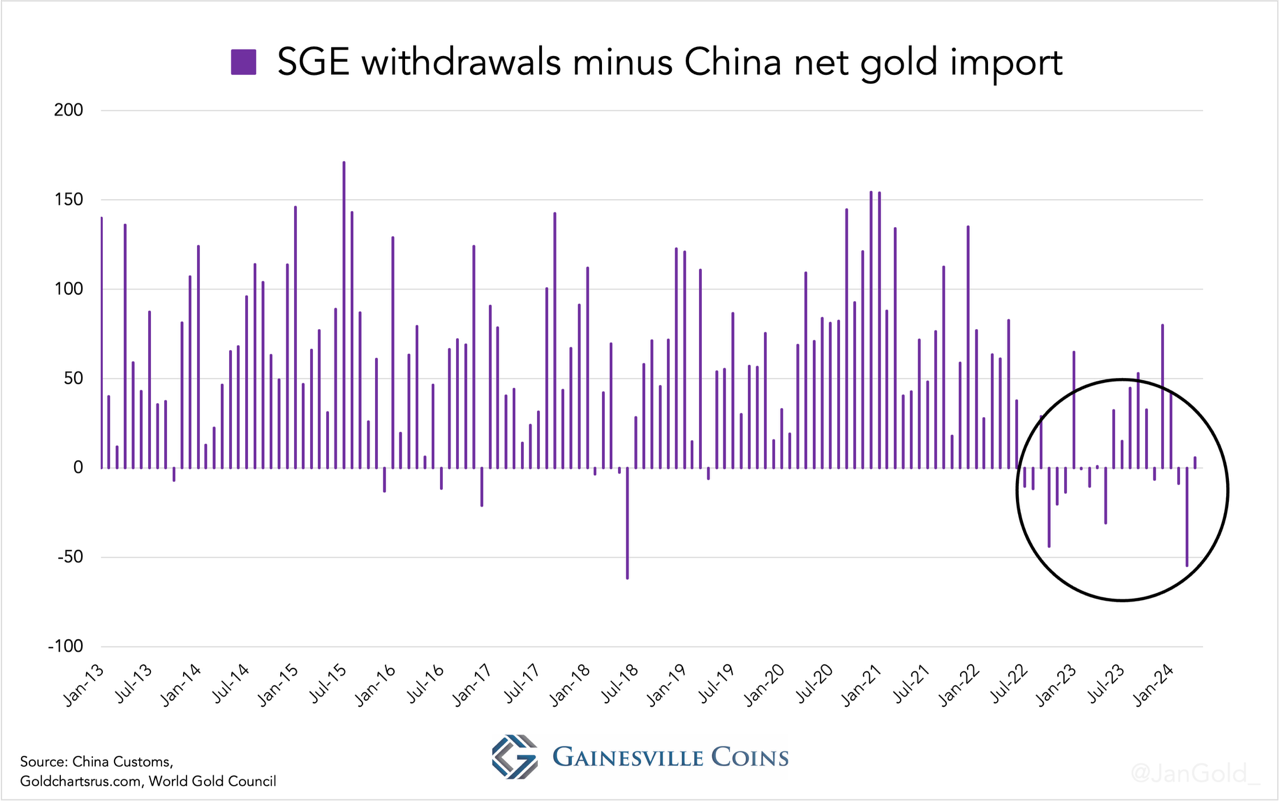
Chart 3. Starting in 2022 there has been an increase in months wherein net imports alone are higher than SGE withdrawals.
Indeed, both in 2022 and 2023 China’s net import plus mine output transcended SGE withdrawals (let alone if we would add recycled gold).
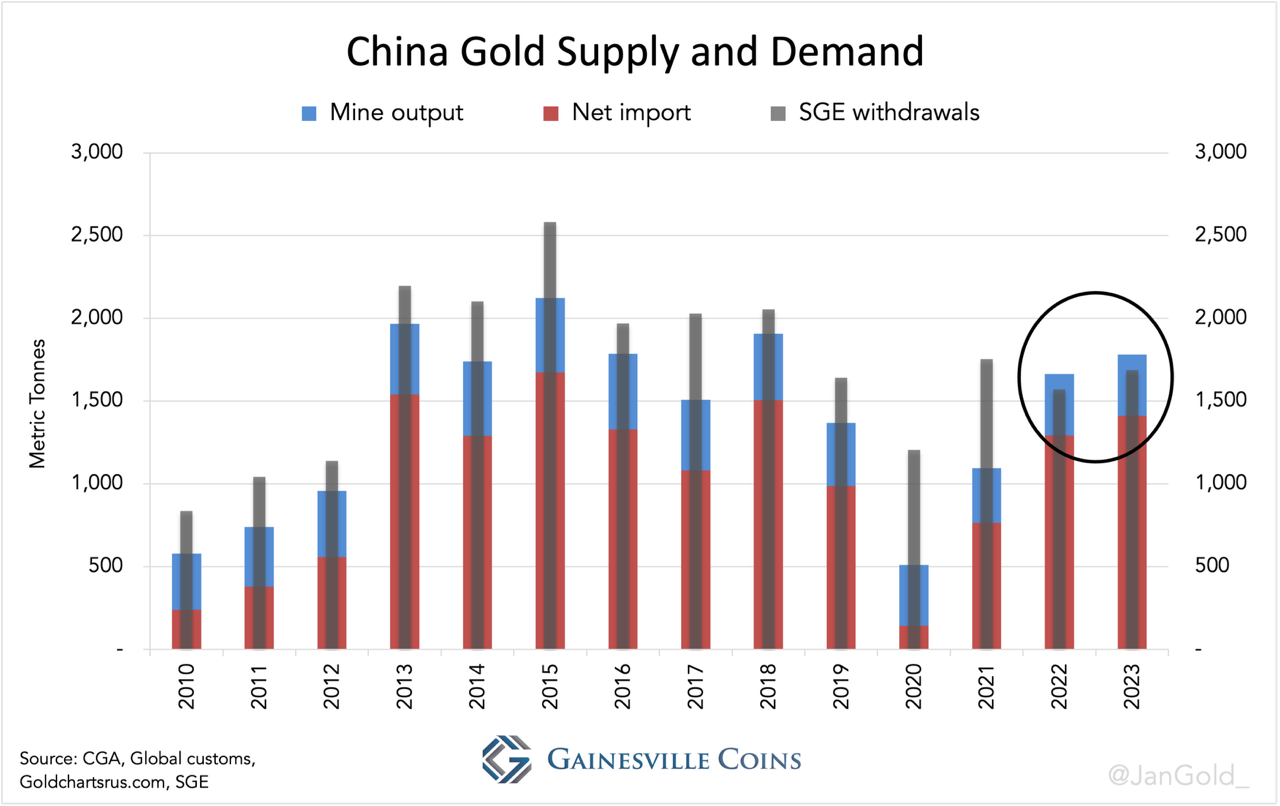
Chart 4. In 2022 and 2023 apparent supply was higher than demand (SGE withdrawals).
As we shall see, the surplus in the Chinese gold market—imports that are not sold through the SGE—is being absorbed by the PBoC.
Readers with deep knowledge of the Chinese gold market might think: “what if the large bars are refined in FTZs and loaded into SGE vaults without being withdrawn?” I checked with a source that has connections to refineries in China, and according to this person the refineries don’t use any large bars as feedstock for producing 1kg bars for the SGE*. Another contact I have, close to the SGE, shared with me that SGE inventory in April 2024 accounted for about 300 tonnes. Inventory had gone up recently together with a rise in the price of gold, this person said. However, the increase in SGE inventory can’t make up for the surplus in the market, which is at least 400 tonnes according to my calculations.
By comparing estimated central bank purchases by the WGC, based on field research, to official statistics regarding gold buying by central banks, we know that since the start of the Ukraine war, in February 2022, monetary authorities in aggregate are secretly buying much more than they report. I have written before that these covert purchases can be attributed for roughly eighty percent to the PBoC.
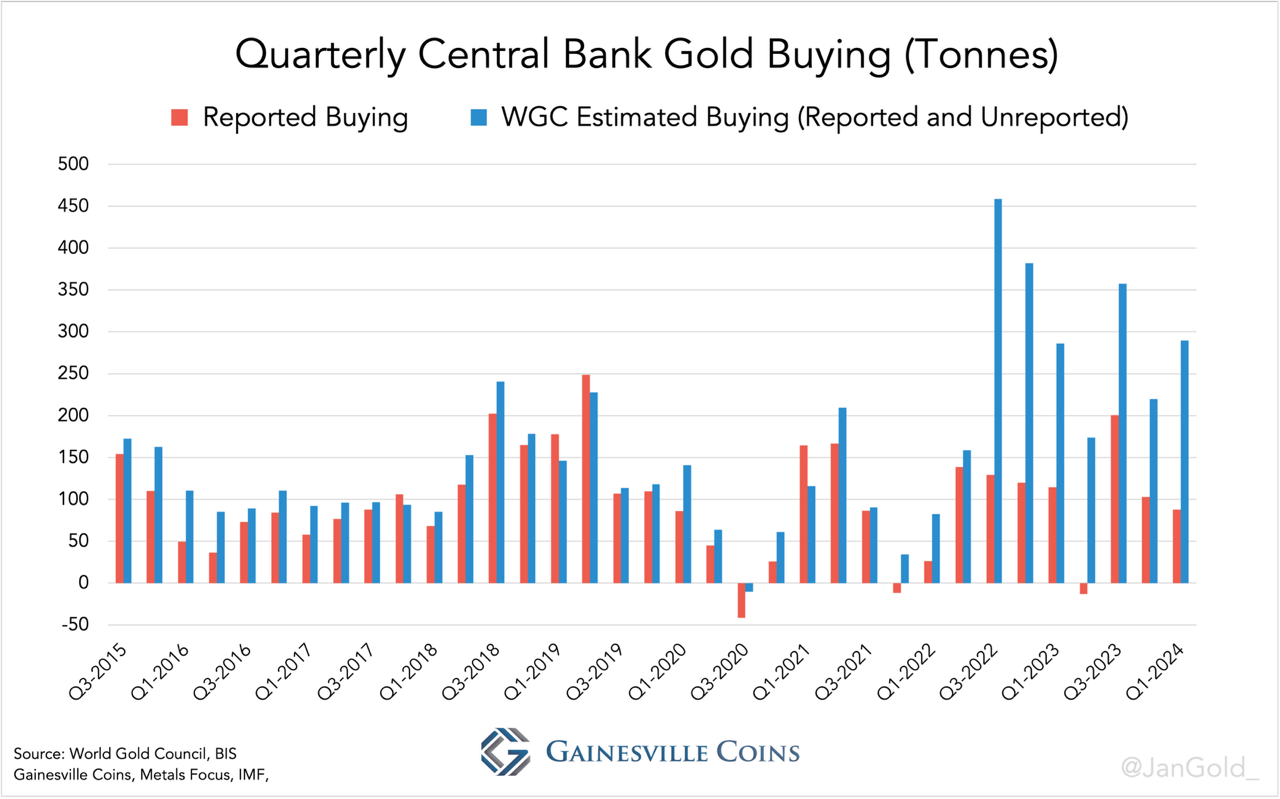
Chart 5. Total estimated central bank gold buying by the WGC, versus official statistics by the International Monetary Fund (IMF). The difference reflects covert acquisitions.
“Unreported” PBoC gold purchases exploded when $300 billion in foreign exchange reserves from the Russian central bank were frozen by the West early 2022 due to the war. Notably, the UK began exporting 400-ounce bars to China in huge tonnages at the same time. Coincidence? I think not. Ever since, China has taken over gold price control from the West and broke the gold price’s correlation with “real rates” (10-year TIPS yield).
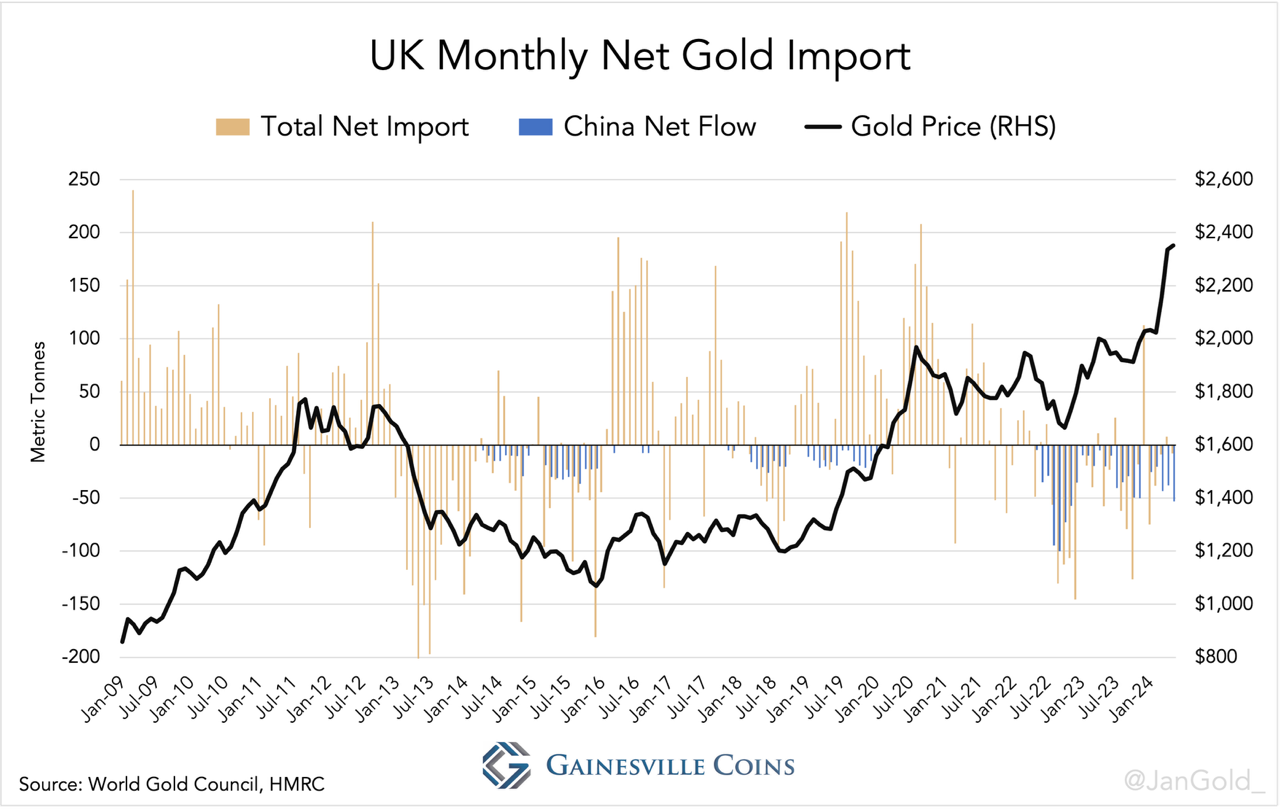
Chart 6. The UK’s direct export to China is likely destined for the PBoC.
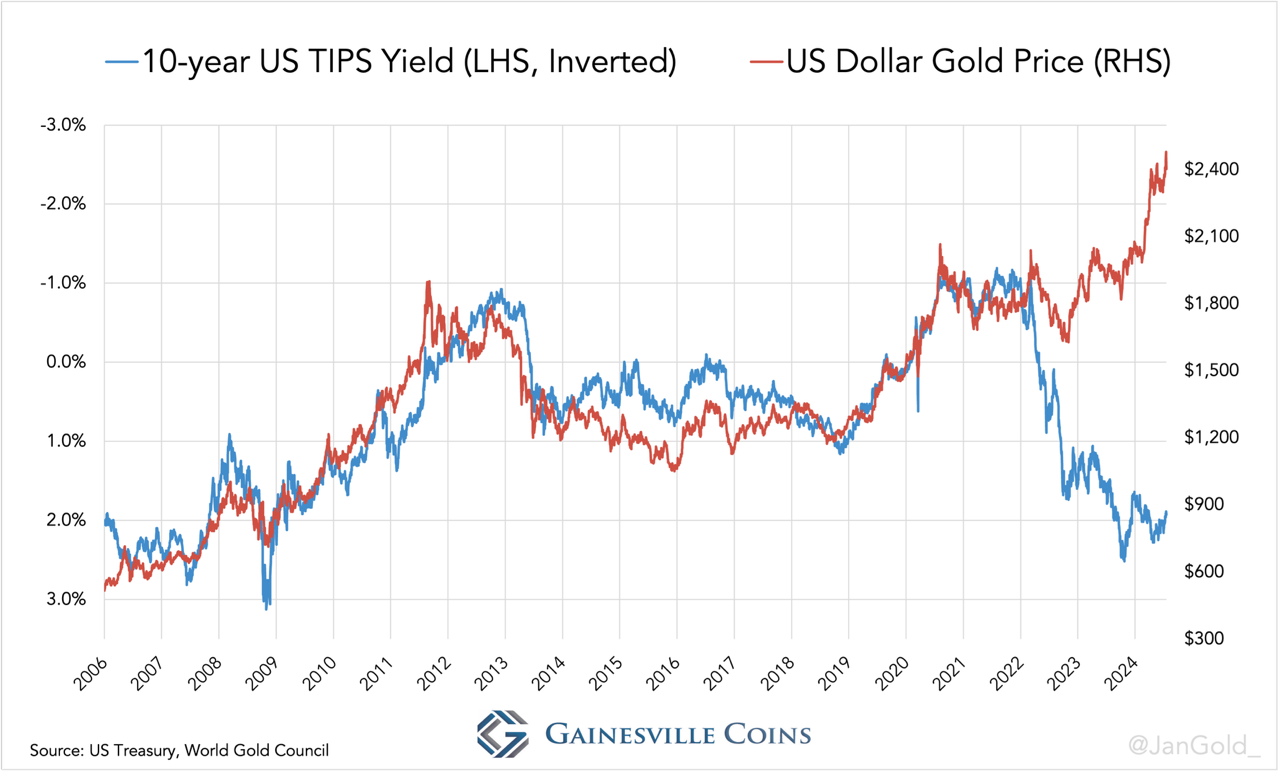
Chart 7. The US dollar gold price versus the 10-year TIPS yield (real rates). Early 2022 the correlation broke because of, inter alia, massive PBoC purchases.
The final clue is that there is a relationship between what the Chinese central bank officially reports to be accumulating, and gold exports from the UK to China. What frequently happens, exposed by comparing these numbers, is that the PBoC starts buying gold a few months before it tells the world about it, and severely underreports its additions. This was the case in 2015, 2019, and 2022.
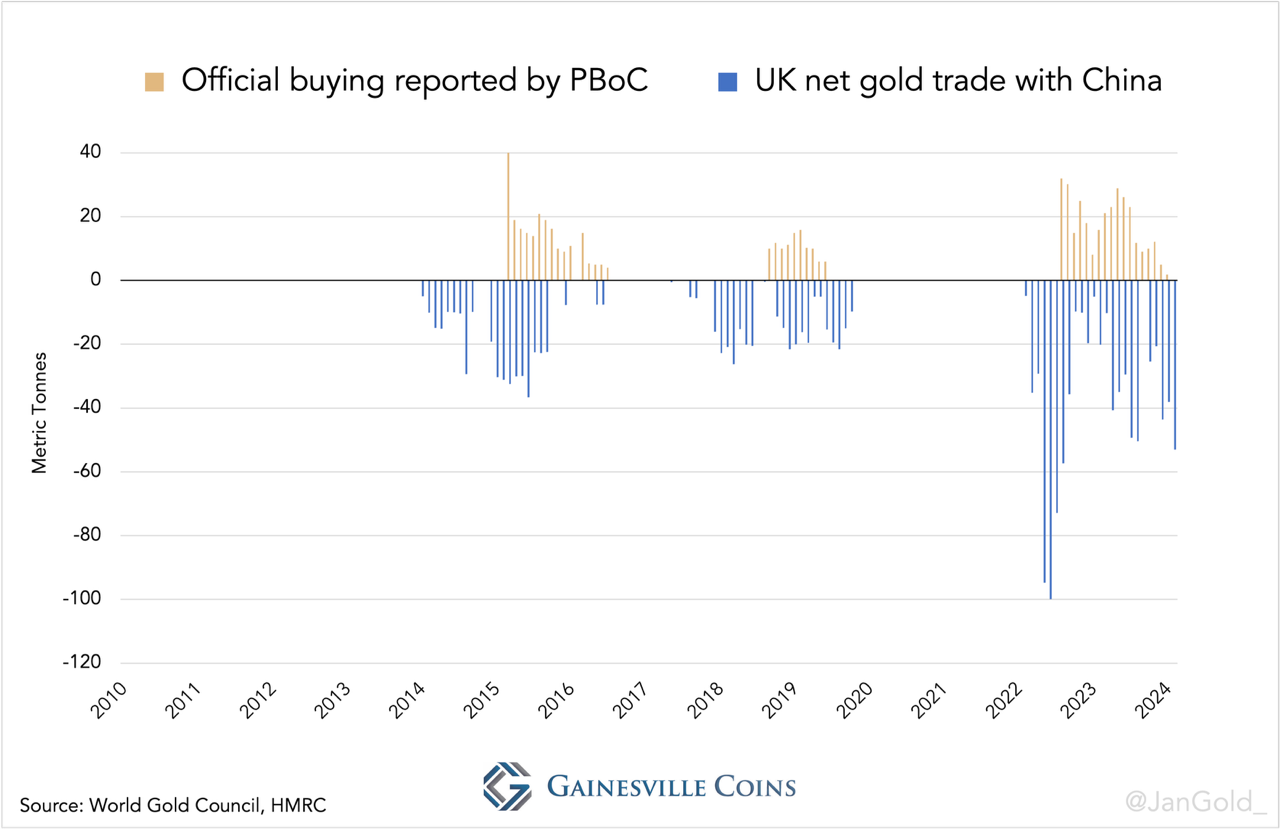
Chart 8. Official data on PBoC gold buying versus UK gold exports to China. Previous exports from the UK for the PBoC were not large enough to create an apparent surplus in the Chinese gold market.
It all fits and makes sense: the motive, the data, and the anecdotal evidence. Let’s summarize our key findings:
It all points towards UK gold exports to China are destined for the PBoC—although probably not every ounce of these flows is for the Chinese central bank. Clearly, the PBoC is accumulating more gold than it wants to disclose.
When the PBoC stated it had stopped buying gold in May 2024, after continuous purchases for 18 months, I didn’t believe it. The PBoC has few reasons to cease growing its gold reserves in the current geo-political and monetary landscape with a plethora of challenges.
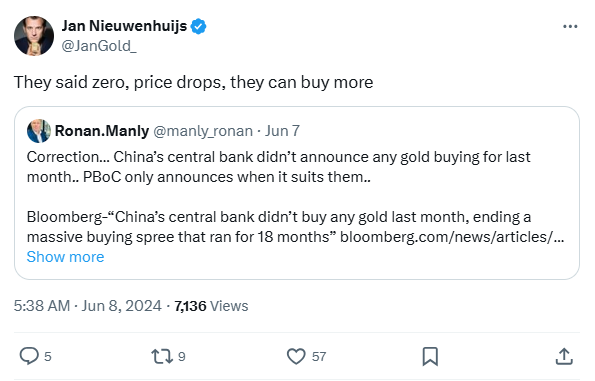
Click on the image to view the tweet on X.
Probably, the PBoC wants the most gold for its dollars, so when the price rises fast it will signal it stopped buying, trying to cool the market. In the meantime, the United Kingdom exported 53 tonnes to China in May, of which likely most found its way to Beijing.
Note, the PBoC also buys in Switzerland and other countries, flows that can be included or excluded in customs reports, but it’s impossible, from where I stand now, to measure all these separately.
Finally, some of my previous analyses have been skewed by the above. Private demand in China has been lower because some (“non-monetary”) imports were taken by the central bank.
*This person’s intelligence doesn’t mean refineries in Chinese FTZs can’t be refining any 400-ounce bars into smaller ingots. It probably happens, but not on a grand scale.

Kitco News) – Centerra Gold was the lowest cost gold producer in Q3 2023 (among 100koz+/quarter producers) measured by all-in sustaining cost metric, followed by Lundin Gold and Perseus Mining. The average AISC reported by lowest cost producers increased by 3% y-o-y, largely due to inflationary pressures.
The following is the list of the top 10 lowest cost gold mining companies in Q3 2023. We looked only at companies that produced more than 100,000 ounces of gold in Q3 2023 and reported all-in sustaining cost (AISC) metric, which serves as an internationally recognized benchmark for operating efficiency. AISC is in USD.
1. Centerra Gold (TSX:CG) (NYSE:CGAU). $827/oz. The company’s AISC on a by-product basis was $827 per ounce in Q3 2023, down 12% compared to $941 per ounce in Q3 2022. According to Centerra, the decrease in AISC on a by-product basis was primarily due to lower gold production costs per ounce and lower corporate general administrative costs. This was partially offset by lower by-product credits as a result of lower copper pounds sold and higher sustaining capital expenditures at the Mount Milligan mine and the Öksüt mine.
2. Lundin Gold (TSX:LUG) (OTCQX:LUGDF). $907/oz. Ecuador-focused gold producer Lundin Gold reported AISC of $907 per oz of gold sold in Q3 2023, up 12% compared to Q3 2022, primarily because of lower gold production due to expected lower grade and recoveries, as well as an increase in sustaining capital activities during the quarter.
3. Perseus Mining (ASX:PRU) (TSX:PRU). $937/oz. Africa-focused gold producer Perseus Mining reported AISC of $937/oz in Q3 2023, which is an increase of 7% from Q3 2022 ($879/oz).
4. Endeavour Mining (LSE:EDV) (TSX:EDV) (OTCQX:EDVMF). $967/oz. Endeavour Mining, the largest gold producer in West Africa, reported AISC from continuing operations of $967/oz in Q3 2023, an increase of 13% over Q3 2022, due to higher costs across all the company’s continuing operations.
5. Evolution Mining (ASX:EVN). $1,056/oz. Australia’s Evolution Mining reported AISC of $1,056/oz in Q3 2023, up 2% compared to AISC of $1,034/oz in Q3 2022.
6. Alamos Gold (TSX:AGI) (NYSE:AGI). $1,121/oz. The company’s Q3 2023 AISC of $1,121 per ounce was 5% lower than the prior year period driven by the low-cost production growth from La Yaqui Grande.
7. Agnico Eagle (NYSE:AEM) (TSX:AEM). $1,210/oz. The company’s AISC increased by 9% when compared to the prior-year period primarily due to higher minesite costs per tonne resulting from inflation.
8. Barrick (NYSE:GOLD) (TSX:ABX). $1,255/oz. Barrick’s AISC was 1% lower than the prior year quarter, mainly due to the impact of the sales mix across the portfolio, with a higher contribution of ounces at a lower cost per ounce from Cortez, Turquoise Ridge and Kibali, combined with lower unit costs at Carlin and lower minesite sustaining capital expenditures on a per ounce basis.
9. Eldorado Gold (TSX:ELD) (NYSE:EGO). $1,259/oz. Eldorado Gold’s AISC increased by 11% y-o-y to $1,259/oz in Q3 2023, primarily due to lower production at Kisladag and price increases for certain commodities and consumables.
10. Kinross (TSX: K) (NYSE: KGC). $1,264/oz. In Q3 2023, the company’s AISC from continuing operations per Au oz. sold on a by-product basis was $1,264, compared with $1,269 in Q3 2022. Kinross noted the ramp-up of production at La Coipa, which continued to be the company’s lowest cost operation in Q3 2023.
Lowest cost gold producers in Q3 2023

筆者大忙,兩個多月沒寫分析,大家別來無恙吧!金銀是筆者的主要分析對象,上篇黄金分析是年初的《金價技術轉勢……今明兩季是關鍵》,半年過去,走勢跟筆者的分析大致吻合,金價極可能正以季度上升之勢展開大行程。
這個大行程與馬田(Martin Armstrong)的經濟信心模式(ECM)一脈相承,筆者曾在2020年7月寫過一篇《私人信心波發力……小心2022年3月出現調整》,指出黄金的上升關鍵在循環逆轉(Cycle Inversion),即私人信心波起落過程中,金價不跟隨信心波下滑而下跌,反而逆向上升,就會累積動能,於拐點後的下個波段中大升。
當下我們剛好經歷了兩次循環逆轉,第一次是較長期的4.3年循環逆轉,亦即是2015.75至2020.05,金價從$1119升至$1572,這次循環逆轉的動能將金價推上$2000以上,於2020年8月初創出$2089歷史新高。第二次最近才發生,是4.3年循環中的小循環,即2022.2至2023.275,金價從$1910升至$2003,筆者相信金價已經在循環逆轉中累積了動能,將以大行程姿態升向2024.35,甚至超越這個日子,於2024.85創出一個歷史高位(詳見2021年5月12日《拐點轉勢明顯……黄金牛市將運行至2024年第四季》)。
馬田在4月10日《The ECM Turning Point This Week》指出,資產市場通常會測試兩次以上高位阻力,才會正式突破,配合黄金月度時機佈陣,他預計金價4月10日的ECM拐點再次挑戰歷史高位後會回調至6月,然後會第四度挑戰歷史新高,並正式突破。這段時間剛好是俄羅斯31.4年政治歷史循環的重大拐點(5月20/21日),金價的突破很可能與地緣政治變化有關。馬田寫此篇分析時,俄烏戰事陷入膠着狀態,走向未明。
ECM再次顯現神奇預測力!執筆時,筆者從多方新聞得知,俄羅斯瓦格納集團(Wagner Group)正式攻陷烏東要塞巴赫穆特(Bachmut),俄總統普京發出賀電,時間剛好是5月20日。這小填有多條公路、鐵路通向烏克蘭多個城市,西面又是無險可守的東歐平原,俄軍可兵分多路,長驅直入,意味着歐美在這場「西方內戰」的重大失利,將進一步打擊人們對歐美政府的信心。


除了地緣政治因素,更關鍵是利率因素!過去一年多,經過美聯儲十多次加息,目前美國息口已經升至2008年金融海嘯爆發前水平,但通脹仍然處於1983年以來的高位,與此同時經濟危機卻亦步亦趨。高息導至美債價格急挫,許多金融機構持有的美債資產大幅萎縮,形成資不抵債,矽谷銀行、瑞信、第一共和銀行相繼在危機中倒下,歐美銀行危機愈演愈烈,至執筆仍未完結。多項經濟數據已顯示美國經濟正步向衰退,例如全美房價從2022年7月至2023年1月已連挫七個月。美國利率何去何從?美國政府已經陷入兩難,暫停加息可能令通脹重燃,再加息可能觸發更大規模的危機。
2022年3月加息周期展開後,市場看淡金價,黄金經歷了罕見的七個月連挫,卻在2022年11月止跌回升,從$1618低位升至執筆時約$1970,將加息以來的下跌幅度全數收復,加息不利黄金的說法再度無法確立,或者說,加息不利黄金只在某種特定條件下才能成立。
筆者留意到,從2022年11月至今的黄金升勢中,有兩處特別明顯的升勢,第一是美國中期選舉那個星期,共和黨取得了眾議院控制權後,金價一周內升超過100美元;第二是矽谷銀行爆雷後那星期,同樣升超過100美元。利率高企下,金價仍能如此上漲,筆者覺得或許市場已經無法預計息口的走勢,利率政策正走向失速,情況有點像1970年代。

通脹升温下,1972年3月美聯儲開啟了加息周期,超初壓不住金價,金息同升,但到了1973年7月,當息口暴加1.75%,至10.25%,金價隨即大挫近20%。不過,到了1974年2月,因為經濟衰退,美聯儲逼於形勢,突然將利率大降2%,市場對利率前景無所適從,短短一個月,就將金價從$130推升至$180美元,隨後又因通脹升温,再度提高利率,然後到1974年底又因衰退加劇,一口氣把息口大降4.75%,利率就像過山車一樣,短時間內忽然大升,忽然大降,金價以一浪高於一浪方式,升至接近$200美元。
這段歷史告訴我們,最有利金價的利率政策不是加息或減息,而是突如其來的利率失速,市場無法為政府的利率政策作部署,當下情況似乎已經愈來愈接近這種失速。
原文連結:
https://www.goldbuginvest.com/goldbuginvest/gold-price-ecm-cycle-inversion/


 |
透明琺瑯Flinqué工藝是先在金屬胎上雕刻出紐索紋或是其他花紋,接著在雕刻好的金屬胎上塗覆透明琺瑯再送入電爐內燒結。與其他琺瑯工藝一樣,因為一次塗上過厚的釉彩可能會在燒結過程中裂開,因此必須反覆數次上釉與燒結的程序,一層一層燒結以達到需要的厚度,最後一次燒結完成後再進行一次打磨拋光,使成品表面光亮。完成的成品可以同時欣賞到溫潤的琺瑯,以及其下細膩的金屬刻紋。 |
| ||

